Two months generated a large share of earnings
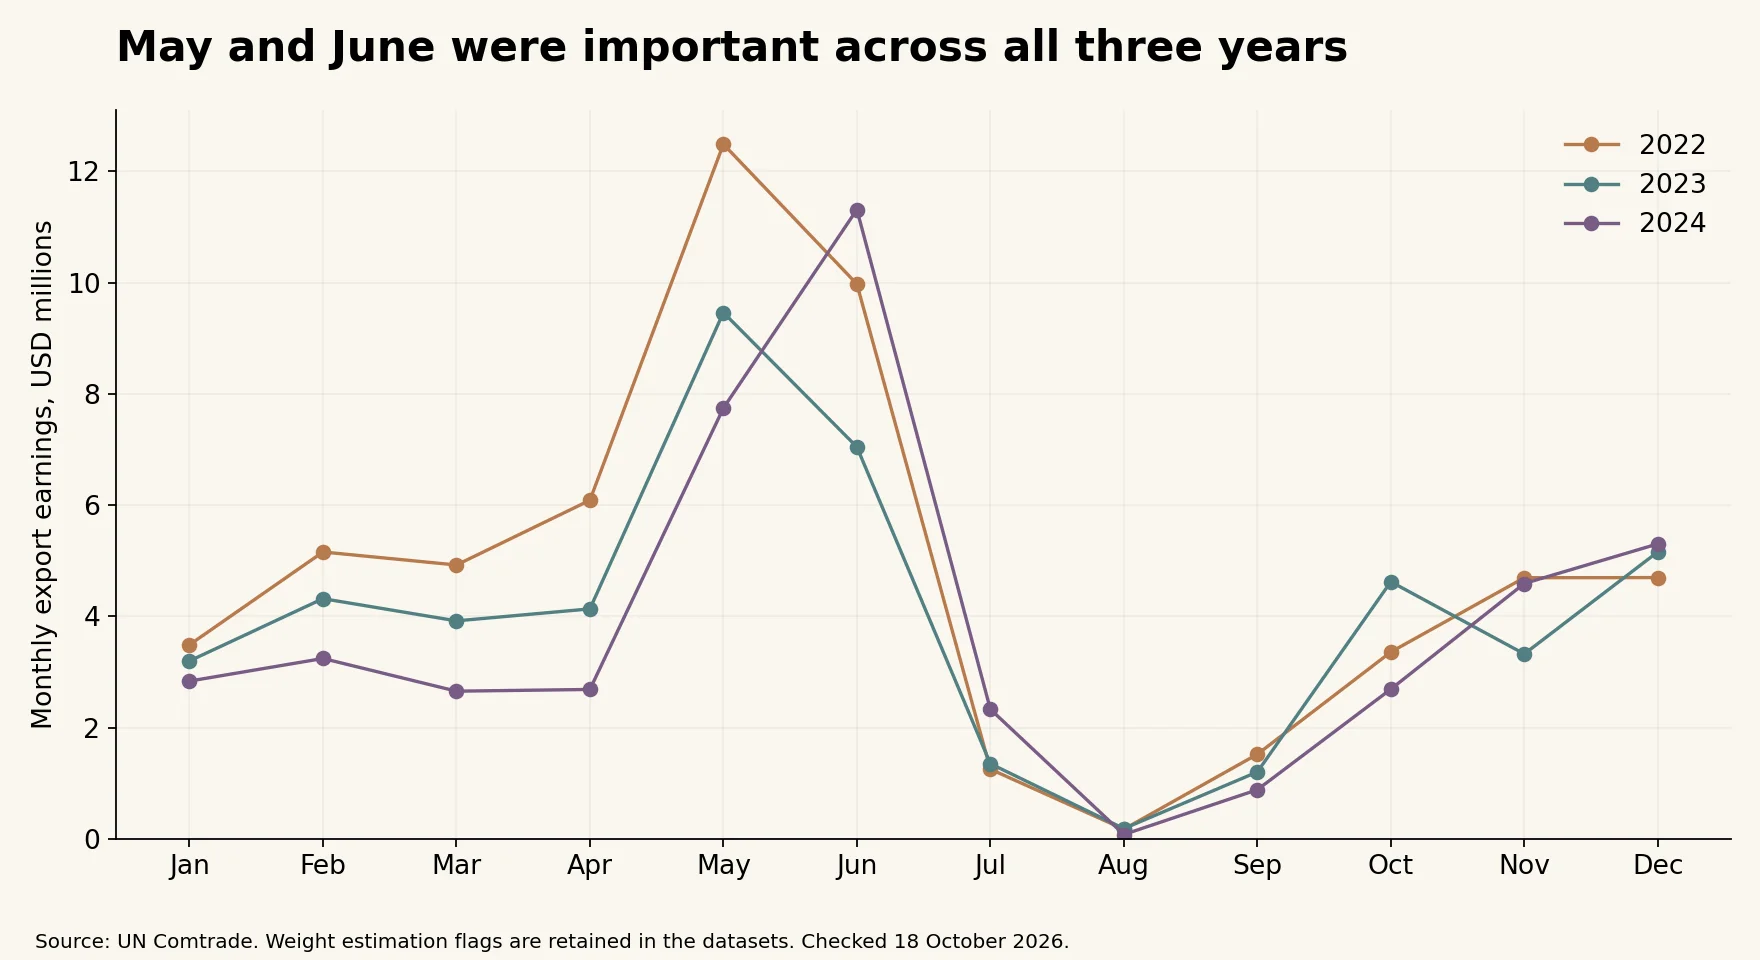
Uzbekistan’s exports of fresh or chilled tomatoes earned $46.4 million in 2024. May contributed $7.7 million and June $11.3 million. Together, these two months generated $19.1 million, or 41.1% of the year’s reported monthly export value.
The pattern was uneven across the rest of the year. August recorded only about $77,740, while December earned $5.3 million. An annual total conceals these differences in the timing of recorded sales.
This report covers HS 070200, tomatoes fresh or chilled, and excludes tomato paste and other processed products. It examines all 36 reported months in 2022–2024, with destination records for each month. Monthly trade describes when exports were recorded, not when tomatoes were harvested or finally consumed.
!Monthly tomato export earnings across three years
A repeated pattern, not identical seasons
May and June together accounted for 38.9% of the monthly export-value sum in 2022, 34.4% in 2023 and 41.1% in 2024. The concentration in those months recurs across the three years, although the height and timing of the peak differed.
May was the highest-value month in 2022 and 2023. June led in 2024, when its $11.3 million represented 24.4% of the reported annual total. Late-year sales remained substantial, so the pattern should not be described as a single short export season with no activity outside it.
The three largest months in 2024—June, May and December—accounted for 52.6% of export value. August was the lowest-value month in all three years. The repeated August trough is descriptive evidence of an uneven calendar pattern, not proof of a particular production or demand mechanism.
!Monthly earnings and net weight in 2024
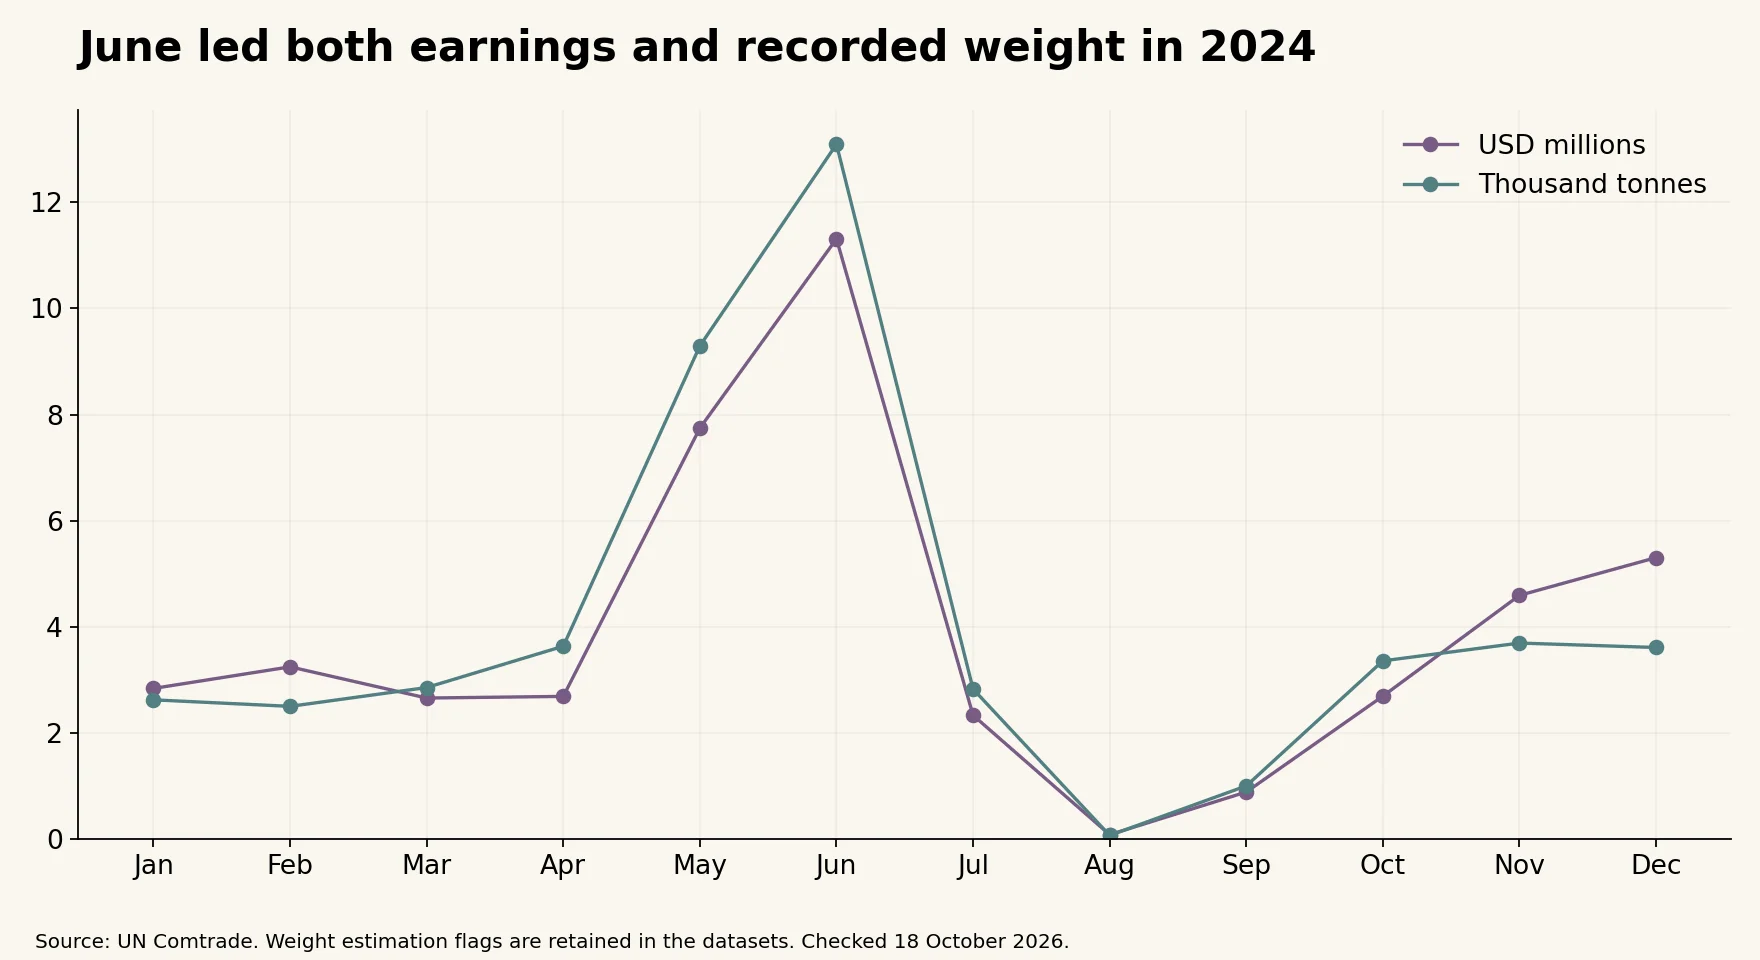
June also led recorded net weight in 2024, at approximately 13,097 tonnes. May recorded 9,294 tonnes, while August recorded about 65 tonnes. The earnings peak therefore coincided with a larger recorded physical flow, rather than appearing only in the value series.
The two lines in the chart use different units: USD millions and thousand tonnes. Their numerical positions should not be interpreted as identical quantities or as profit margins. Unit values can be calculated from the records, but are not retail prices and do not deduct costs.
The destination mix changed through the year
Russia bought $38.0 million of Uzbekistan’s tomato exports in 2024, or 81.9% of total export value. Its share varied by month. It was 95.6% in February and 95.9% in December, compared with 72.4% in June.
August’s Russia share was only 48.0%, but this was also an exceptionally small month for total exports. A lower share in a tiny month should not be treated as evidence of large-scale diversification. Shares and dollar values need to be read together.
!Russia share of monthly tomato export value
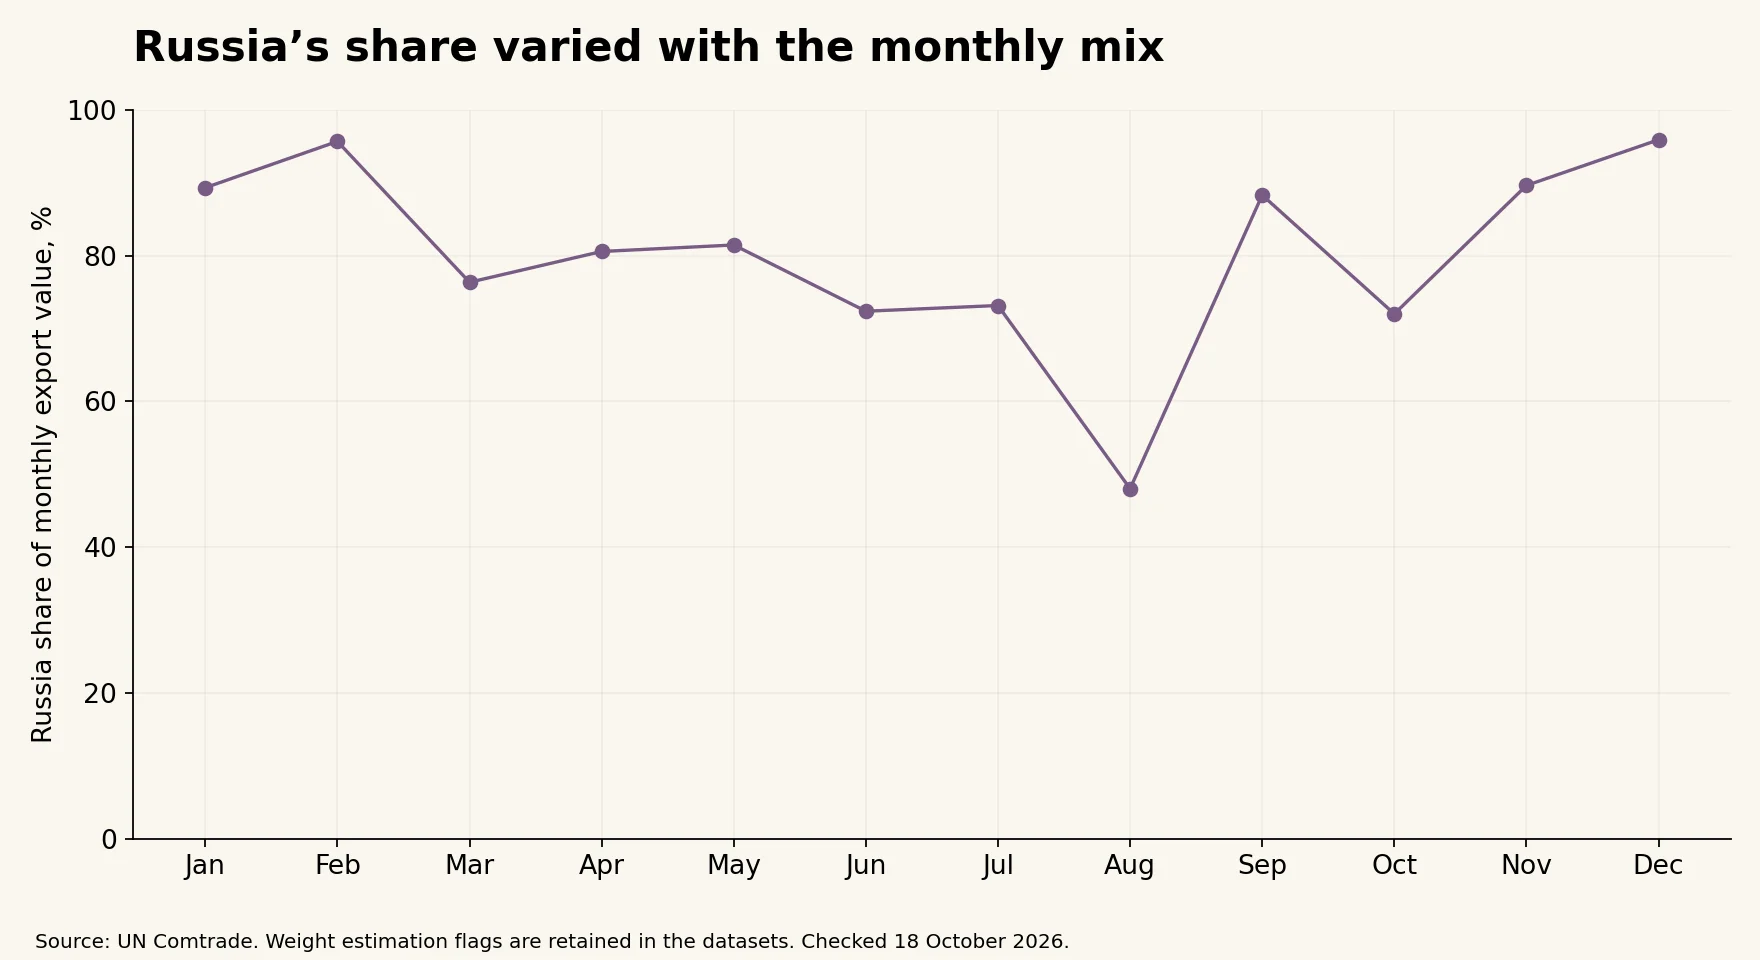
The monthly destination shares use each month’s world total as the denominator. They are not calculated by dividing monthly partner sales by the annual total, and the annual Russia share is not a simple average of the 12 monthly shares. The annual share weights months by their export value.
These records identify immediate destinations. They do not reveal the number of importing firms, final consumers or subsequent re-exports. A changing monthly mix may reflect product composition, contracts, shipment timing or other factors that these totals cannot separate.
A source discrepancy that must stay visible
The 2022 monthly export values sum exactly to the separate annual world value of $57.8 million. The 2024 monthly sum also matches its separate annual value of $46.4 million exactly.
For 2023, however, the 12 monthly values sum to $47.9 million, while the separately reported annual record is $52.2 million. The difference is $4.3 million, or about 8.3% of the annual value. All months were returned; the difference is not filled by inventing an extra month or distributing the gap across existing months.
This report calculates seasonal shares from the sum of the 12 monthly records in each year. It preserves the separate annual value as a reconciliation reference and does not use the 2023 annual total as the denominator for a monthly seasonal share. The available records do not establish why the discrepancy exists; source revisions or reporting differences require further investigation.
What this pattern can and cannot explain
The evidence supports a repeated concentration of reported export earnings in May and June, alongside a smaller August flow and substantial late-year sales. Russia remained the dominant destination overall, but its share changed with the monthly mix.
The analysis does not establish whether weather, greenhouse production, domestic demand or transport conditions caused the pattern. Answering those questions requires evidence on production calendars, varieties, prices, costs and commercial arrangements. Three years also provide a limited basis for claiming a permanent seasonal relationship.
For exporters or researchers, the useful next step is to examine whether the same calendar pattern persists and whether alternative destinations gain meaningful dollar sales during high-volume months. A percentage-share change during a very small month is a weaker signal than sustained growth in substantial markets.
Sources and method
The monthly dataset contains 36 world-total records for January 2022 through December 2024. The destination dataset contains all 205 returned month-partner records, with world totals excluded to prevent double-counting. Partner values reconcile to each month’s world total within $0.20, and no duplicate period-partner keys were found.
UN Comtrade queries use monthly goods, Uzbekistan reporter 860, exports, HS 070200, partner2 0, customs C00 and transport mode 0. Periods were queried individually. Values are current USD; tonnes equal net kilograms divided by 1,000. The 2024 world weights for August, September and November are flagged as estimated; other monthly world weights in this series are not flagged. Flags remain in both datasets.
Annual world records are used only as reconciliation checks and for explicitly identified annual figures. The 2023 discrepancy is retained in the accompanying source evidence. Monthly shares use same-month world values; seasonal shares use each year’s monthly-value sum. The monthly file’s year, month and period fields must be used together—rows are months, not annual totals.
Data checked October 18, 2026. September 30 is the series date.
UN Comtrade · World Bank WITS annual cross-check, 2024
Download the datasets
- Uzbekistan monthly tomato exports by destination 2022–2024
- Uzbekistan monthly tomato exports 2022–2024
Cover photograph
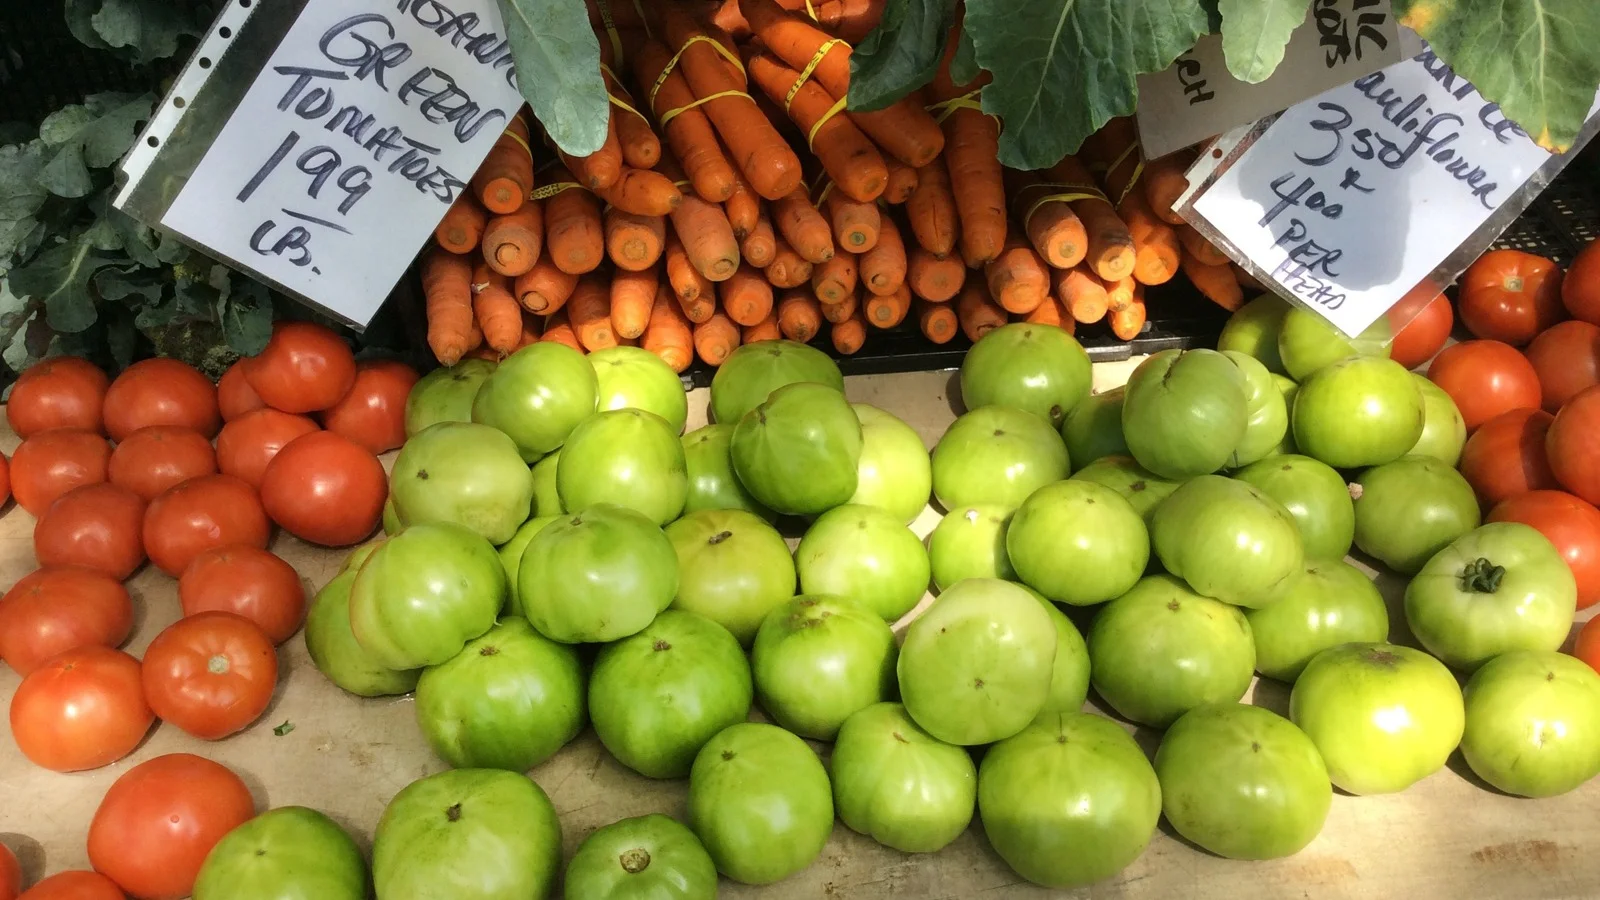
Alabama Extension, Red and Green Tomatoes at a Farmers Market, CC0. Cropped for the cover format. Illustrative photograph; it does not document a shipment or farm in Uzbekistan.
