
A small earnings decline hides a larger weight change
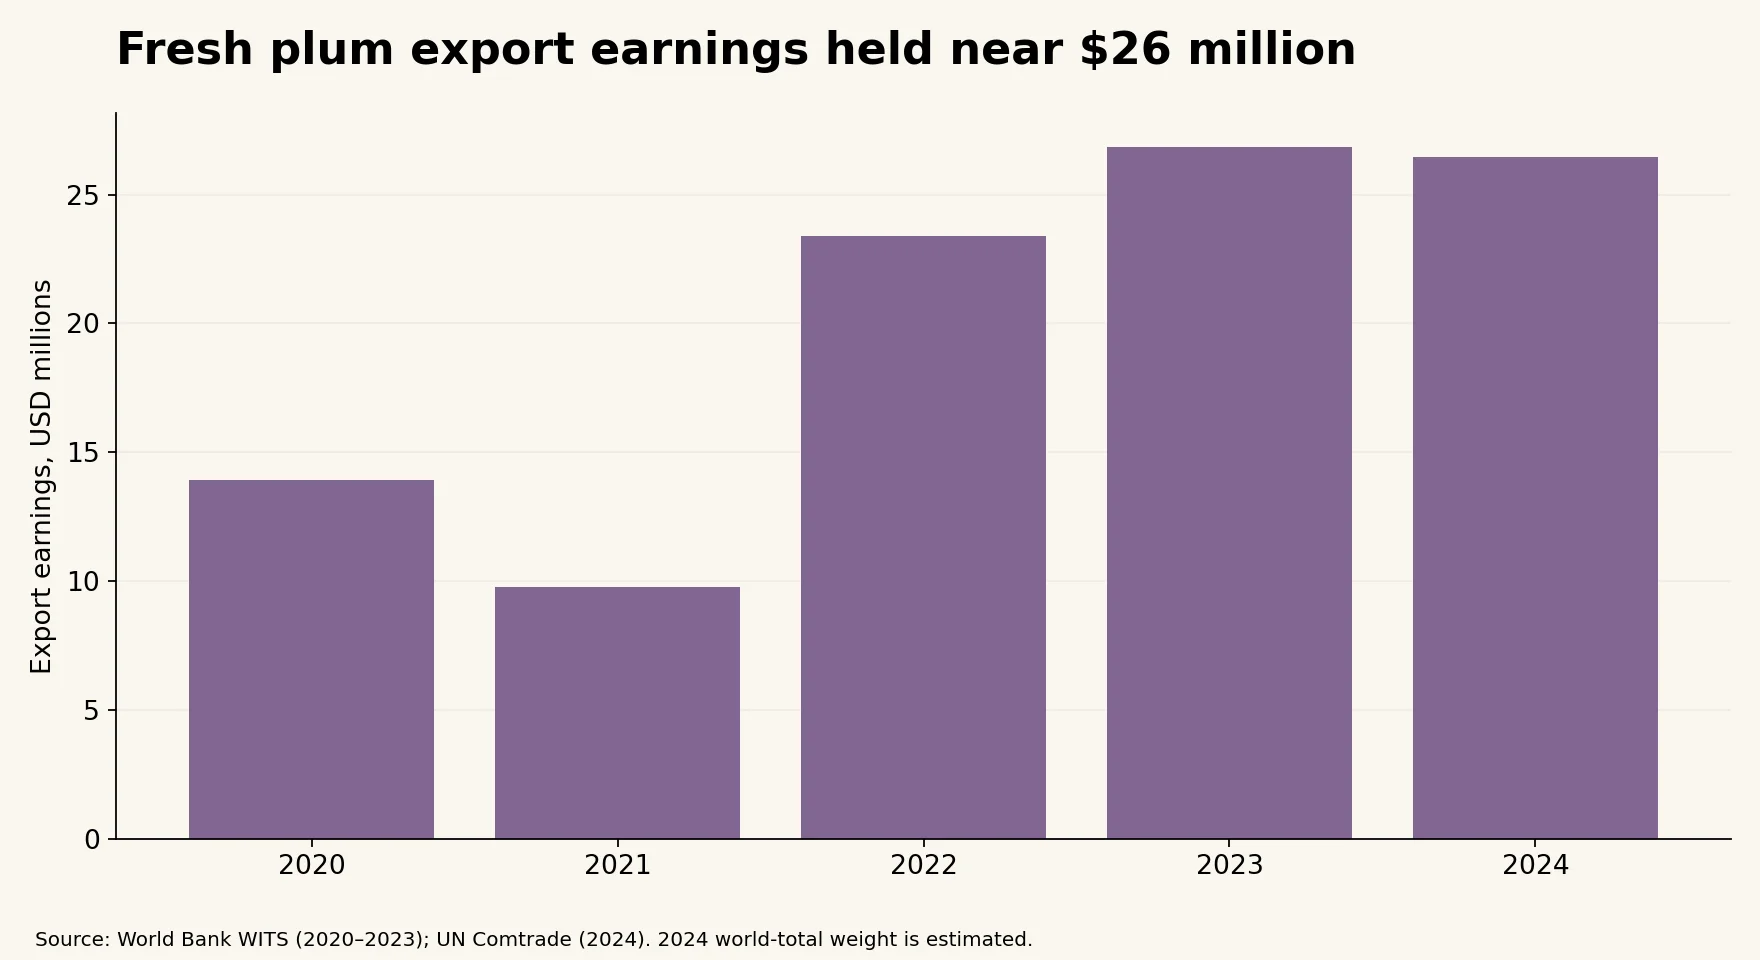
Uzbekistan’s fresh plum and sloe exports earned $26.4 million in 2024. That was 1.4% below the $26.8 million recorded in 2023. Behind this modest earnings decline was a much sharper change in recorded export weight: from approximately 49,093 tonnes to 33,013 tonnes, a fall of 32.8%.
The report covers HS 080940, officially “plums and sloes, fresh.” It does not include dried plums, which belong to a different trade category. “Fresh plums” is used as shorthand throughout, while the datasets retain the full product scope.
The five-year series shows an uneven path. Earnings fell from $13.9 million in 2020 to $9.8 million in 2021, recovered to $23.4 million in 2022, and reached $26.8 million in 2023. The 2024 result remained well above the early years of this period, despite its small decline from the preceding year.
!Annual fresh plum export earnings
Two buyers dominate the destination map
Russia purchased $16.2 million of Uzbekistan’s fresh plum exports in 2024, accounting for 61.1% of total value. Kazakhstan bought $8.9 million, or 33.7%. Together, these two immediate destinations accounted for 94.7% of export earnings.
Kyrgyzstan was the third-largest destination, with purchases of $1.2 million, or 4.6%. All remaining destinations combined accounted for less than 1%. The records include shipments to Belarus, the United Arab Emirates and several other markets, but their presence should not be confused with a substantial spread of earnings across buyers.
The 2024 destination dataset contains 13 partner records. A large number of recorded destinations can coexist with highly concentrated sales: the size of each market matters as well as its presence in the table.
!Fresh plum destinations in 2024
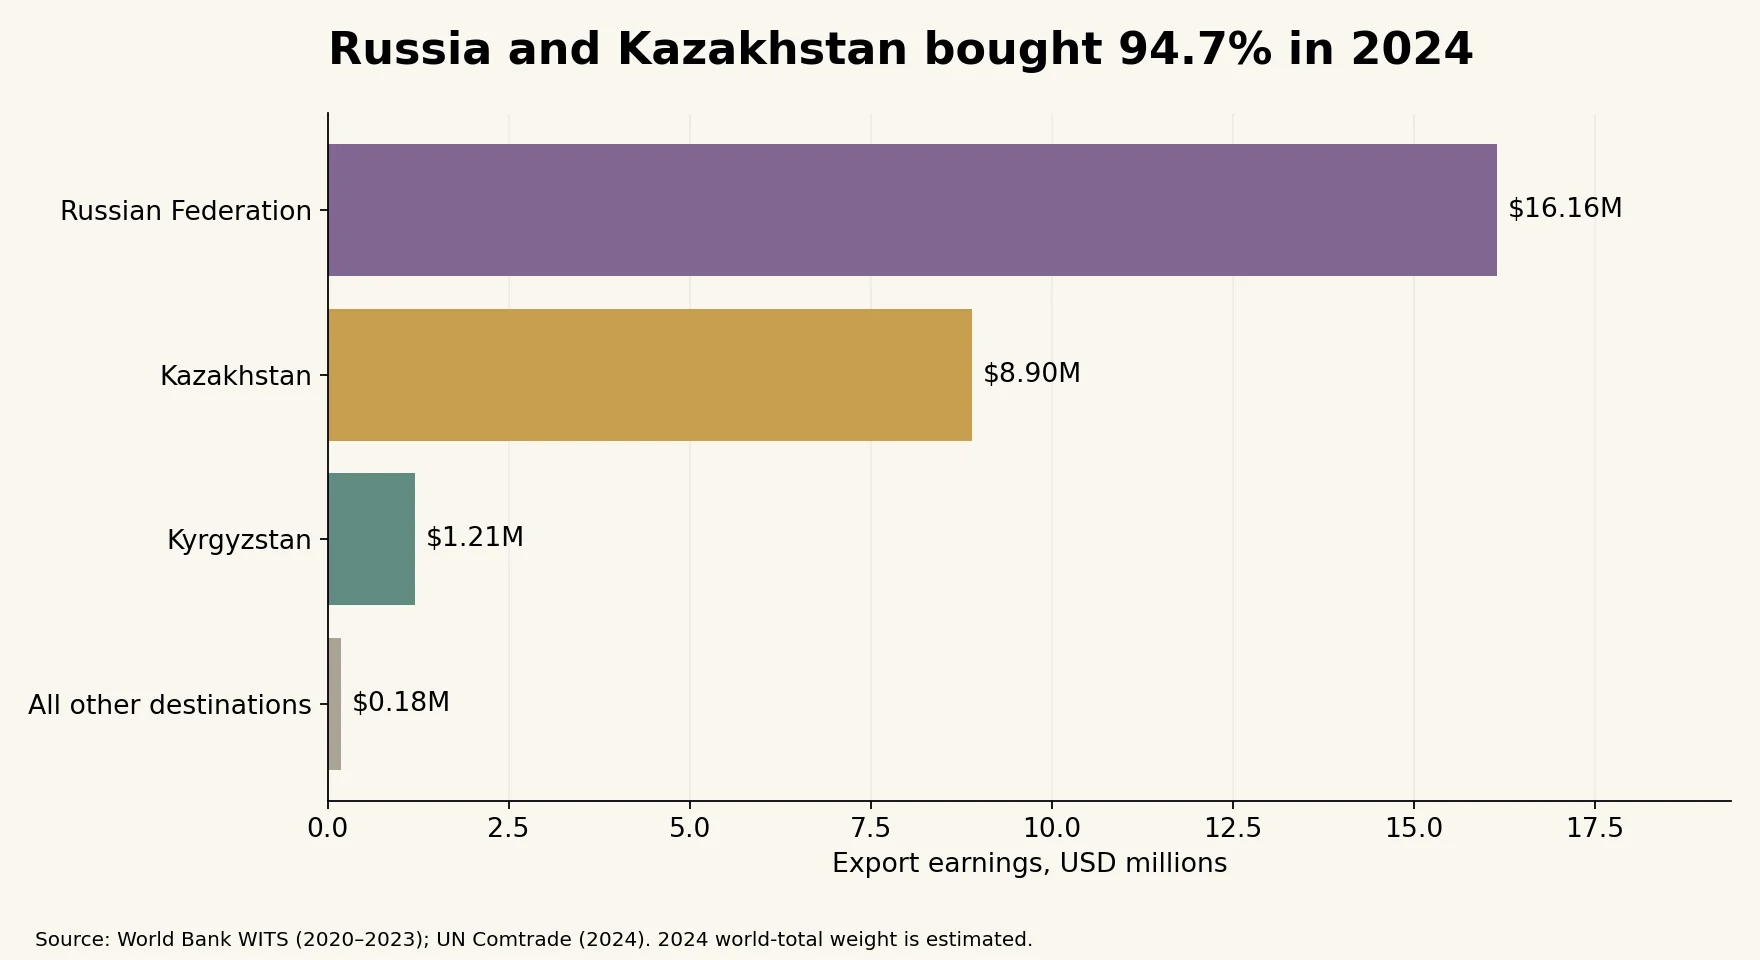
This concentration identifies exposure to a small group of immediate markets. It does not establish the number of importing firms, the final consumers, or subsequent re-exports. These data also do not identify the commercial reasons behind the destination pattern, such as contracts, transport costs or market-access conditions.
A shift in recorded destinations requires caution
The combined share going to Russia and Kazakhstan was approximately 63.4% in the 2023 WITS table, compared with 94.7% in 2024. Russia’s recorded purchases increased from $10.7 million to $16.2 million, while Kazakhstan’s increased from $6.3 million to $8.9 million.
However, the 2023 table also includes $4.5 million assigned to an unspecified destination, equivalent to about 16.8% of the world total. Kyrgyzstan’s purchases were much larger in 2023 than in 2024. These features make a simple interpretation of the apparent concentration increase risky: the records describe a change in destination reporting and sales, but cannot establish how much reflects a change in final demand or trade routing.
The unspecified 2023 entry must not be silently assigned to Russia, Kazakhstan or any other country. It remains part of the 2023 world total when calculating shares.
Higher value per kilogram is not proof of higher profit
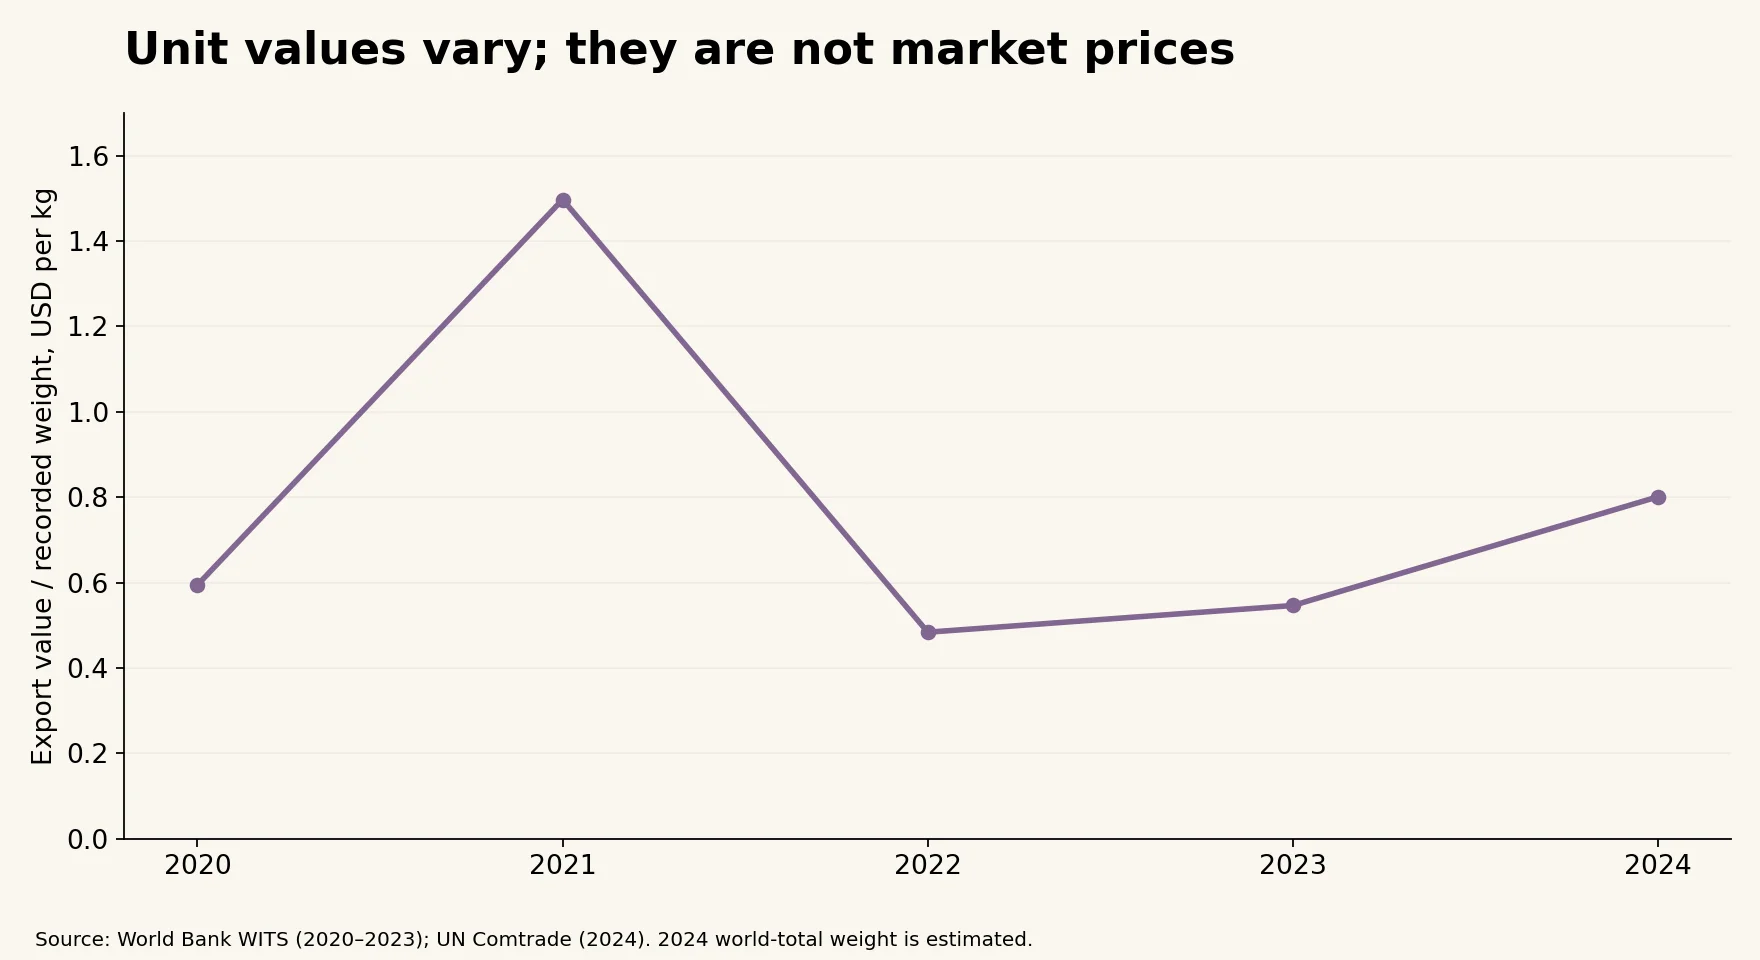
Dividing earnings by recorded net weight gives an aggregate unit value of approximately $0.80 per kilogram in 2024, up from $0.55 in 2023. The increase was about 46.6%. This ratio helps explain how earnings could remain near their previous level while recorded weight fell substantially.
The ratio was approximately $0.59 in 2020, $1.50 in 2021 and $0.48 in 2022. Its variation is a reason to investigate reporting, product composition and shipment conditions, rather than treat it as a directly observed market-price series.
!Fresh plum aggregate export unit values
UN Comtrade flags the 2024 world-total net weight as estimated. The earlier WITS tables used here do not expose the corresponding estimation flags, so their absence from those tables is not evidence that the weights were directly observed. Comparisons of weight and unit value should retain this limitation.
Unit value also does not measure profit. The records do not deduct growing, sorting, packaging, storage or delivery costs. Nor do they hold constant the quality, variety or timing of exported fruit. The data support a statement about aggregate trade value per kilogram, not a claim that every farmer or exporter received a higher price.
What the next season should clarify
The clearest 2024 result is the concentration of recorded earnings in Russia and Kazakhstan. The next useful questions are whether total export weight recovers and whether other destinations become commercially meaningful. A sustained increase in sales outside the two leading markets would be stronger evidence of a broader market base than the appearance of very small shipments to additional countries.
Understanding why the pattern changes would require information beyond annual customs totals. Shipment timing, product specifications, transport conditions and exporter costs would help distinguish changes in demand from changes in the composition or reporting of trade.
Sources and method
The annual dataset covers 2020–2024. The 2020–2023 values and quantities are transcribed from World Bank WITS tables based on UN Comtrade, at their displayed precision. WITS monetary figures are in thousands of US dollars and are multiplied by 1,000. The 2024 annual and destination records come directly from the UN Comtrade preview API: annual goods, Uzbekistan reporter 860, exports, HS 080940, partner2 0, customs C00 and transport mode 0. The 2024 original classification is H6.
The 13 destination values reconcile exactly to the 2024 world value. World totals are excluded from the destination CSV to prevent double-counting. The annual file uses world totals, not a second sum of partner records. Shares divide destination value by the same year’s world total; changes compare 2024 with 2023. Tonnes equal net kilograms divided by 1,000, and unit value equals USD divided by net kilograms.
The 2019 WITS table displays zero for world-total quantity despite positive shipments to individual partners. It is excluded from this annual series rather than interpreted as no exports or used to construct an artificial unit value. The destinations dataset covers 2024 only; no earlier partner records are implied. No regional production dataset is claimed.
Data and sources were checked on October 18, 2026. September 6 is the series date.
Download the datasets
2024 export destinations · Annual exports, 2020–2024
Cover photograph
Fumikas Sagisavas, Black plums, CC0. Cropped for the cover format. Illustrative photograph; it does not document a shipment or farm in Uzbekistan.
