A growing export sector can still have a deficit
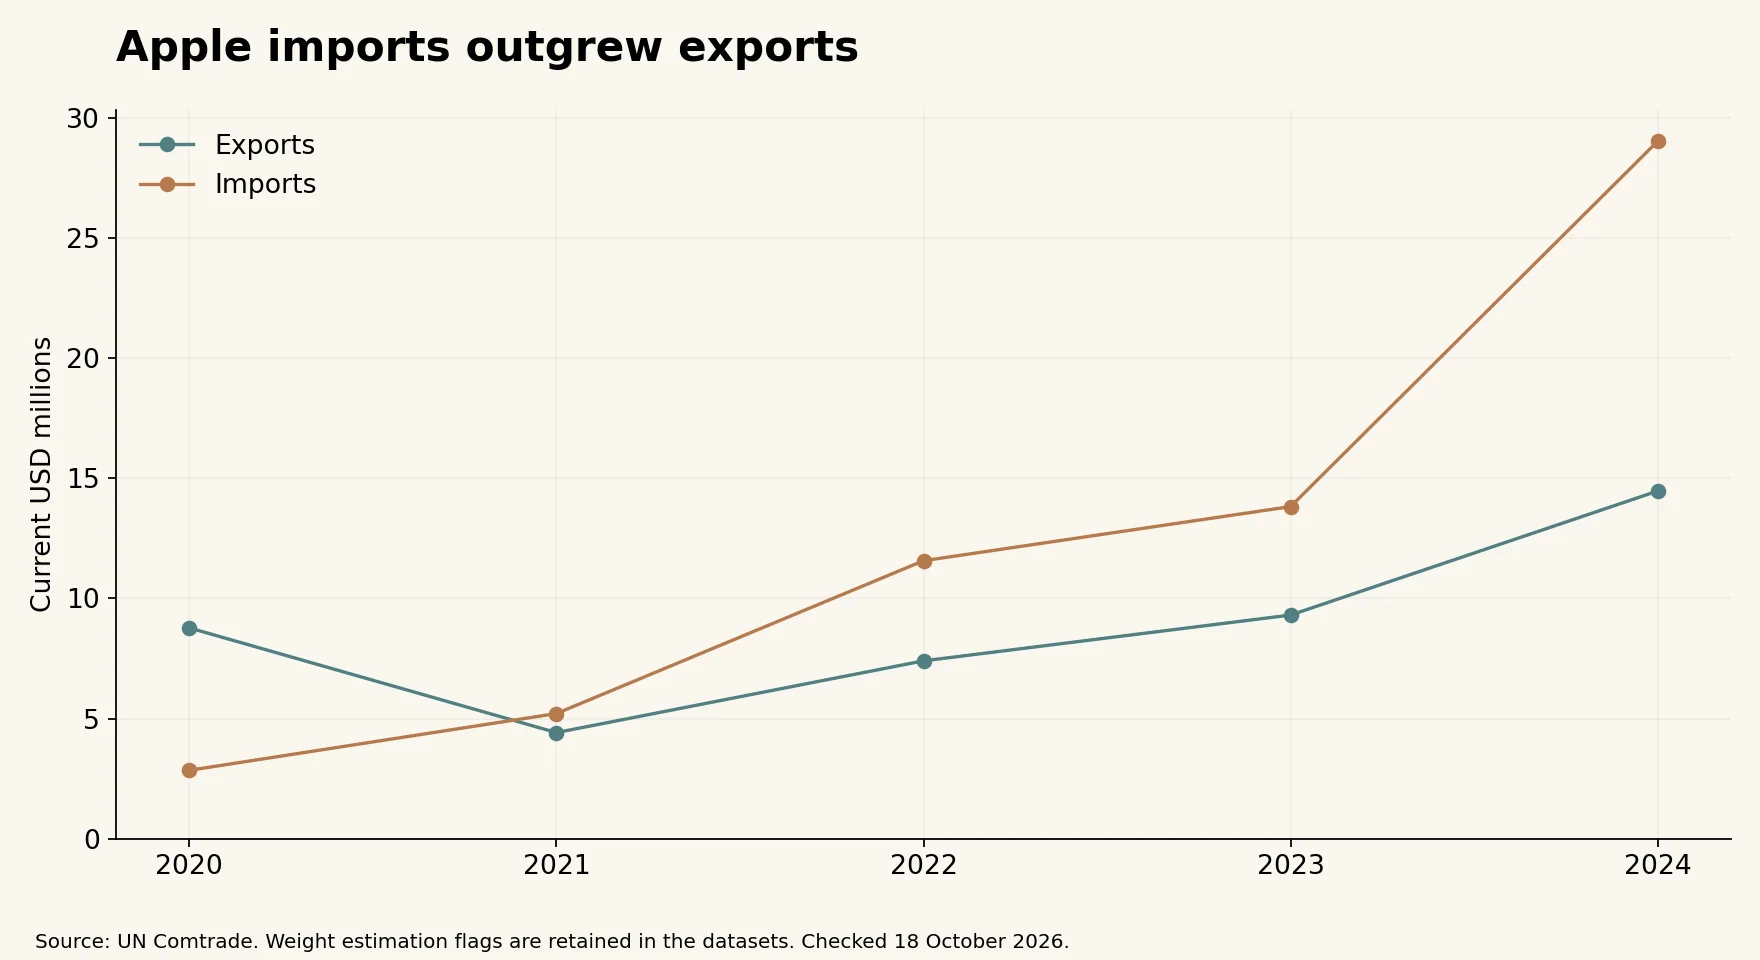
Uzbekistan exported $14.5 million of fresh apples in 2024, but imported $29.0 million. The result was a $14.6 million deficit in the recorded value of fresh-apple trade. Export growth did not prevent the deficit from widening because import value increased by more.
This report covers fresh apples under HS 080810. It excludes juice, dried apples and other processed products. The question is whether Uzbekistan was a net exporter or net importer of this category, and how that position changed during 2020–2024.
The trade balance is calculated as export value minus import value. A positive result is a surplus and a negative result is a deficit. This is a product-level goods-trade measure, not a national balance-of-payments calculation or a measure of business profitability.
From a surplus to four consecutive deficits
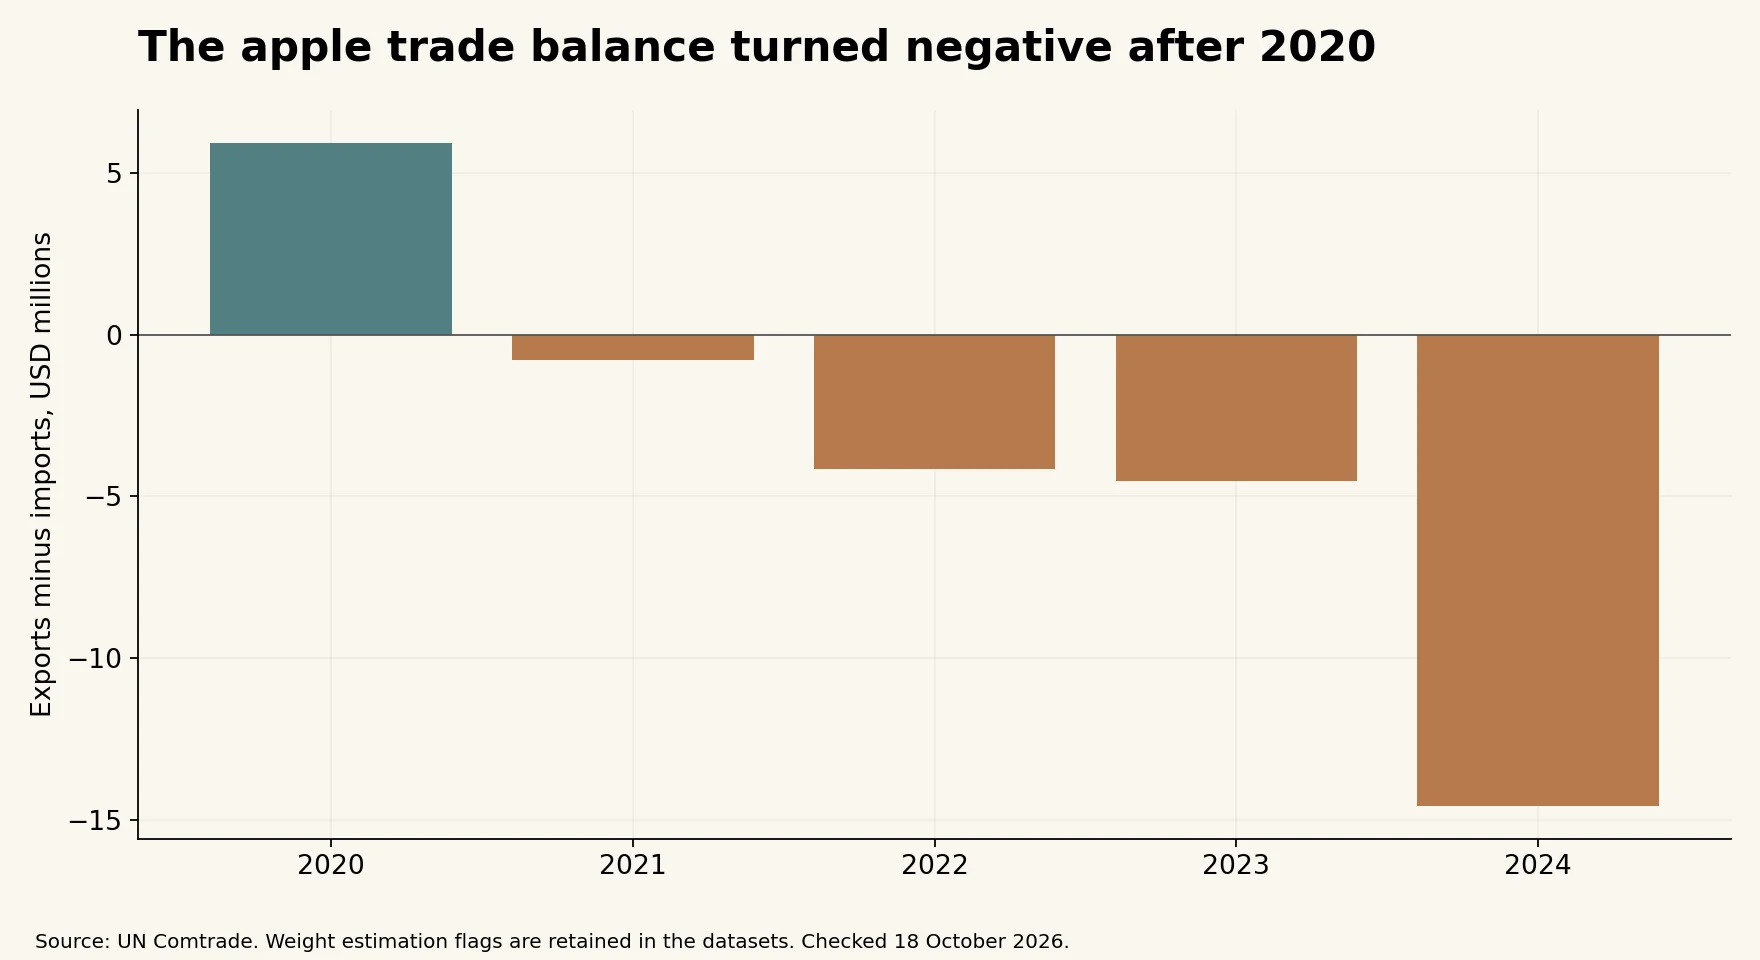
The five-year series begins with a surplus in 2020: exports of $8.8 million exceeded imports of $2.9 million by approximately $5.9 million. In 2021, exports fell to $4.4 million while imports rose to $5.2 million, producing a deficit of approximately $0.8 million.
The deficit widened to $4.2 million in 2022 and $4.5 million in 2023. By 2024 it reached $14.6 million. Uzbekistan therefore moved from a fresh-apple surplus in 2020 to deficits in each of the following four years in this series.
This change describes recorded cross-border flows. It does not by itself reveal whether domestic production fell, consumption increased, stocks changed, or different grades were traded in opposite directions. Those explanations require additional data.
Both trade flows grew in 2024
Exports increased 55.4% from $9.3 million in 2023 to $14.5 million in 2024. Imports increased more rapidly, rising 110.0% from $13.8 million to $29.0 million. In dollar terms, the import increase was approximately $15.2 million, against an export increase of $5.2 million.
Recorded import weight reached 99,810 tonnes in 2024, compared with export weight of 44,252 tonnes. Imports exceeded exports by both value and recorded weight. The weight comparison has a limitation: the 2024 export world-total weight is estimated by UN Comtrade, while the import world-total weight is not flagged as estimated.
A trade gap can widen during an export expansion. Looking only at the export growth rate would miss the larger change on the import side. Looking only at the deficit would miss the increase in overseas sales.
Different partners serve the two trade flows
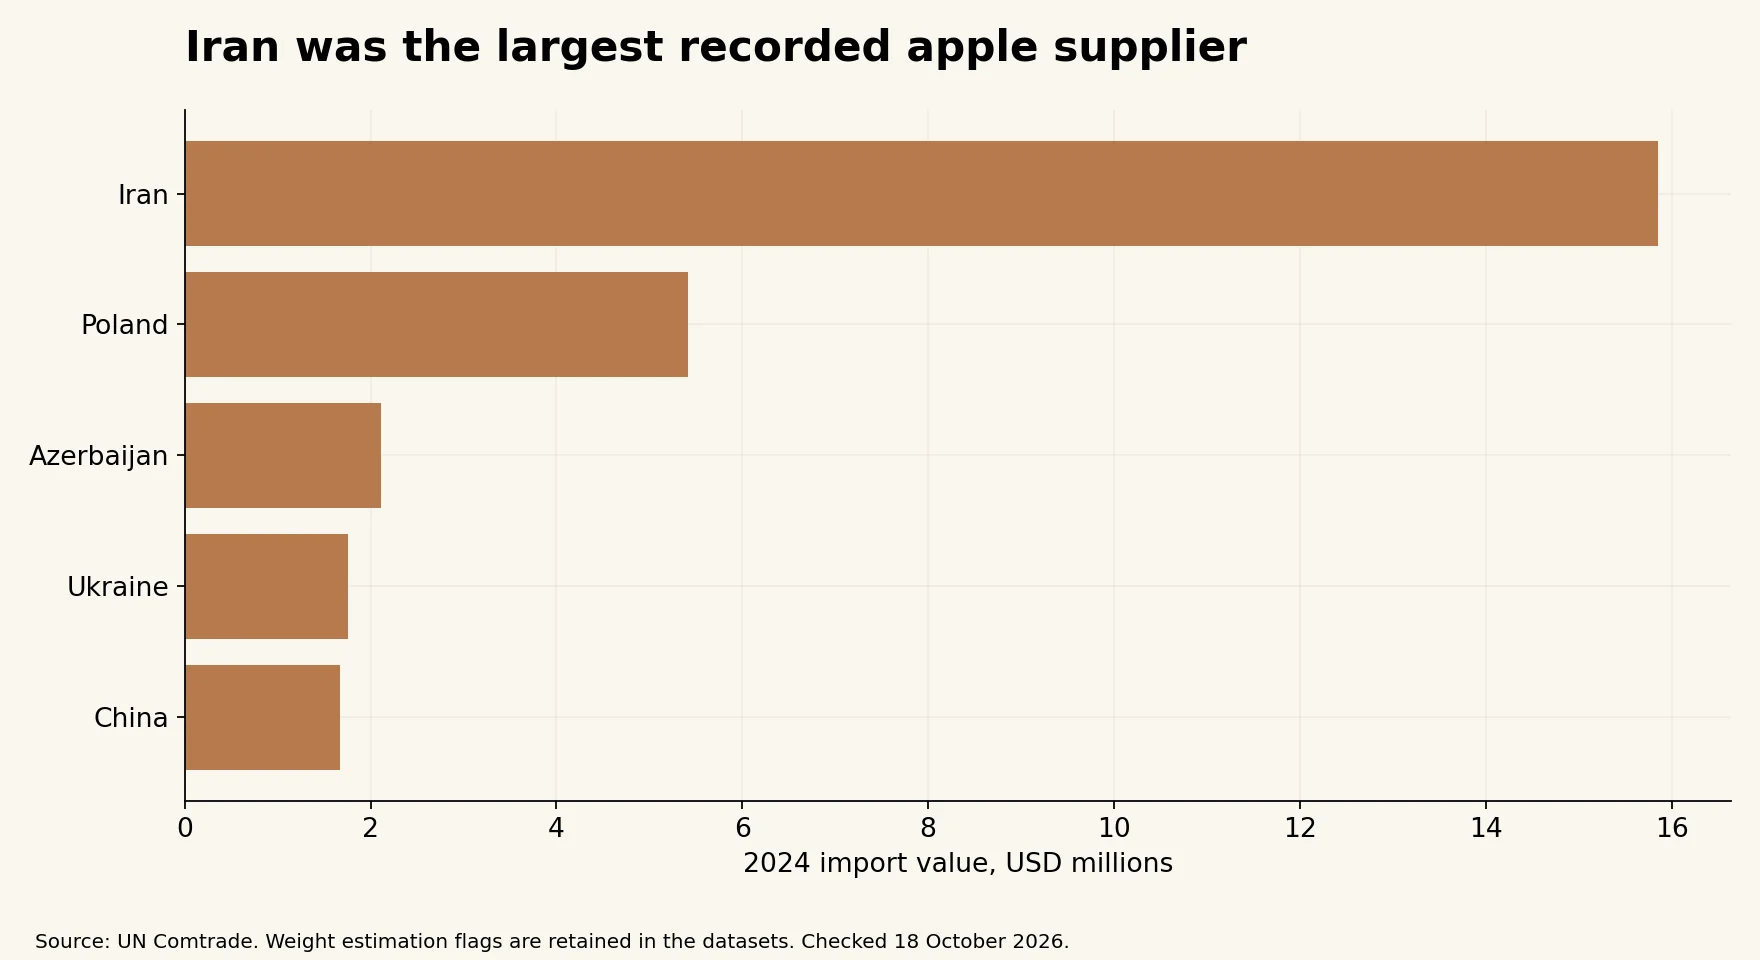
Iran supplied $15.8 million of Uzbekistan’s apple imports in 2024, accounting for 54.6% of import value. Poland supplied $5.4 million, or 18.7%, and Azerbaijan $2.1 million, or 7.3%. Together, these three origins accounted for approximately 80.5% of imports by value.
!Leading apple import suppliers
The export map was different. Kazakhstan purchased $11.1 million, or 76.4% of export value. Russia bought $2.0 million, or 13.5%, and Kyrgyzstan $1.3 million, or 9.1%. The three destinations accounted for approximately 99.0% of exports by value.
The partner dataset records export destinations and import origins with a flow column, so the two directions remain distinguishable. It should not be summed across both flows to produce a measure of either exports or imports. Partner labels identify immediate trading partners and do not establish final consumption or subsequent re-exports.
What a deficit does not tell us
A negative trade balance does not establish that apple farming is unprofitable or that an import-substitution policy would improve welfare. The datasets do not measure consumer preferences, product quality, seasonal availability, domestic prices or production costs.
Exports are generally valued on a free-on-board basis, while imports generally use cost, insurance and freight valuation. That difference limits a direct comparison of per-kilogram trade values as if they were identical market prices. It does not eliminate the usefulness of the reported goods-trade balance, but it should remain visible in interpretation.
The annual export and import unit values also reflect product mix and reporting differences. They should not be treated as retail prices or evidence of a trading margin. A kilogram exported need not be the same grade, variety or shipment as a kilogram imported.
The next questions require different evidence
The clearest result is a shift toward larger recorded import values, alongside growing exports in 2024. A useful follow-up would examine monthly flows to see whether imports and exports concentrate in different parts of the year. A production comparison would require a consistent fresh-apple production series and information on stocks and losses.
Until those data are added, the supported conclusion is narrow: Uzbekistan’s recorded fresh-apple imports exceeded exports in 2021–2024, and the value deficit widened markedly in 2024.
Sources and method
The annual dataset contains five paired export/import world totals for 2020–2024. The partner file retains every returned partner-year-flow record and excludes world totals to prevent double-counting. Export and import values reconcile separately to their annual world totals within $0.20 in every year. No duplicate year-partner-flow keys were found.
UN Comtrade queries use Uzbekistan reporter 860, HS 080810, annual goods, exports or imports, partner2 0, customs C00 and transport mode 0. Original classifications are H5 for 2020–2022 and H6 for 2023–2024. Estimation flags are retained separately for exports and imports. Values are current USD; tonnes equal net kilograms divided by 1,000. Balances equal exports minus imports, and growth compares 2024 with 2023 using unrounded records.
Data checked October 18, 2026. September 25 is the series date.
UN Comtrade · World Bank WITS import cross-check, 2024
Download the datasets
- Uzbekistan fresh apple trade by partner and flow 2020–2024
- Uzbekistan fresh apple exports and imports 2020–2024
Cover photograph
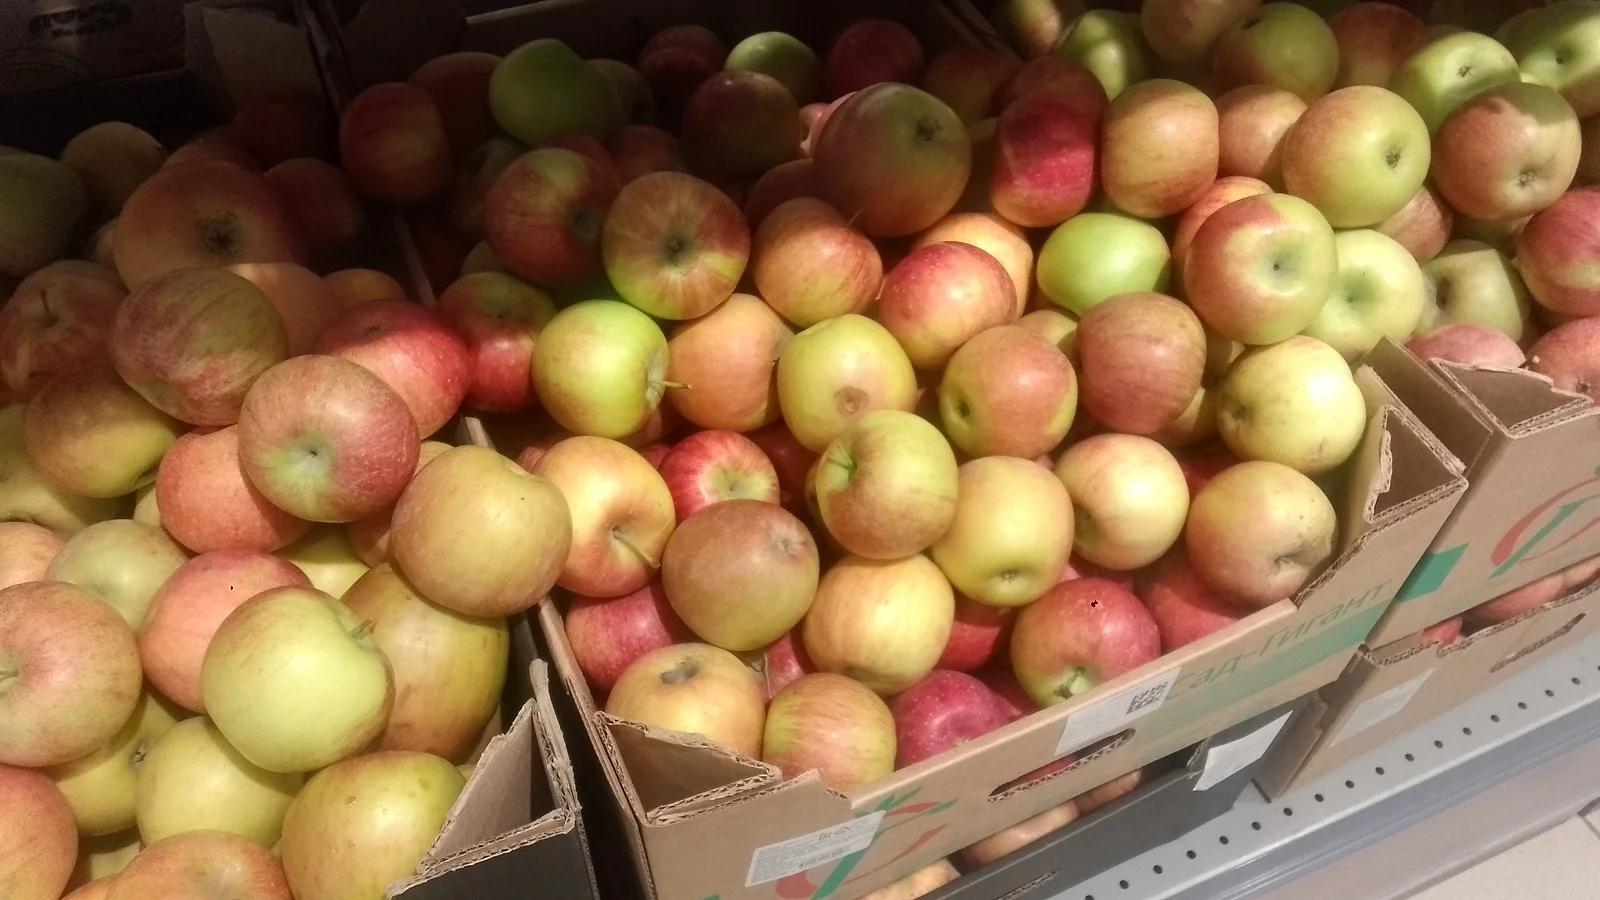
JustKronos, Apples in boxes, CC0. Cropped for the cover format. Illustrative photograph; it does not document a shipment or farm in Uzbekistan.
