A retreat from the 2023 peak
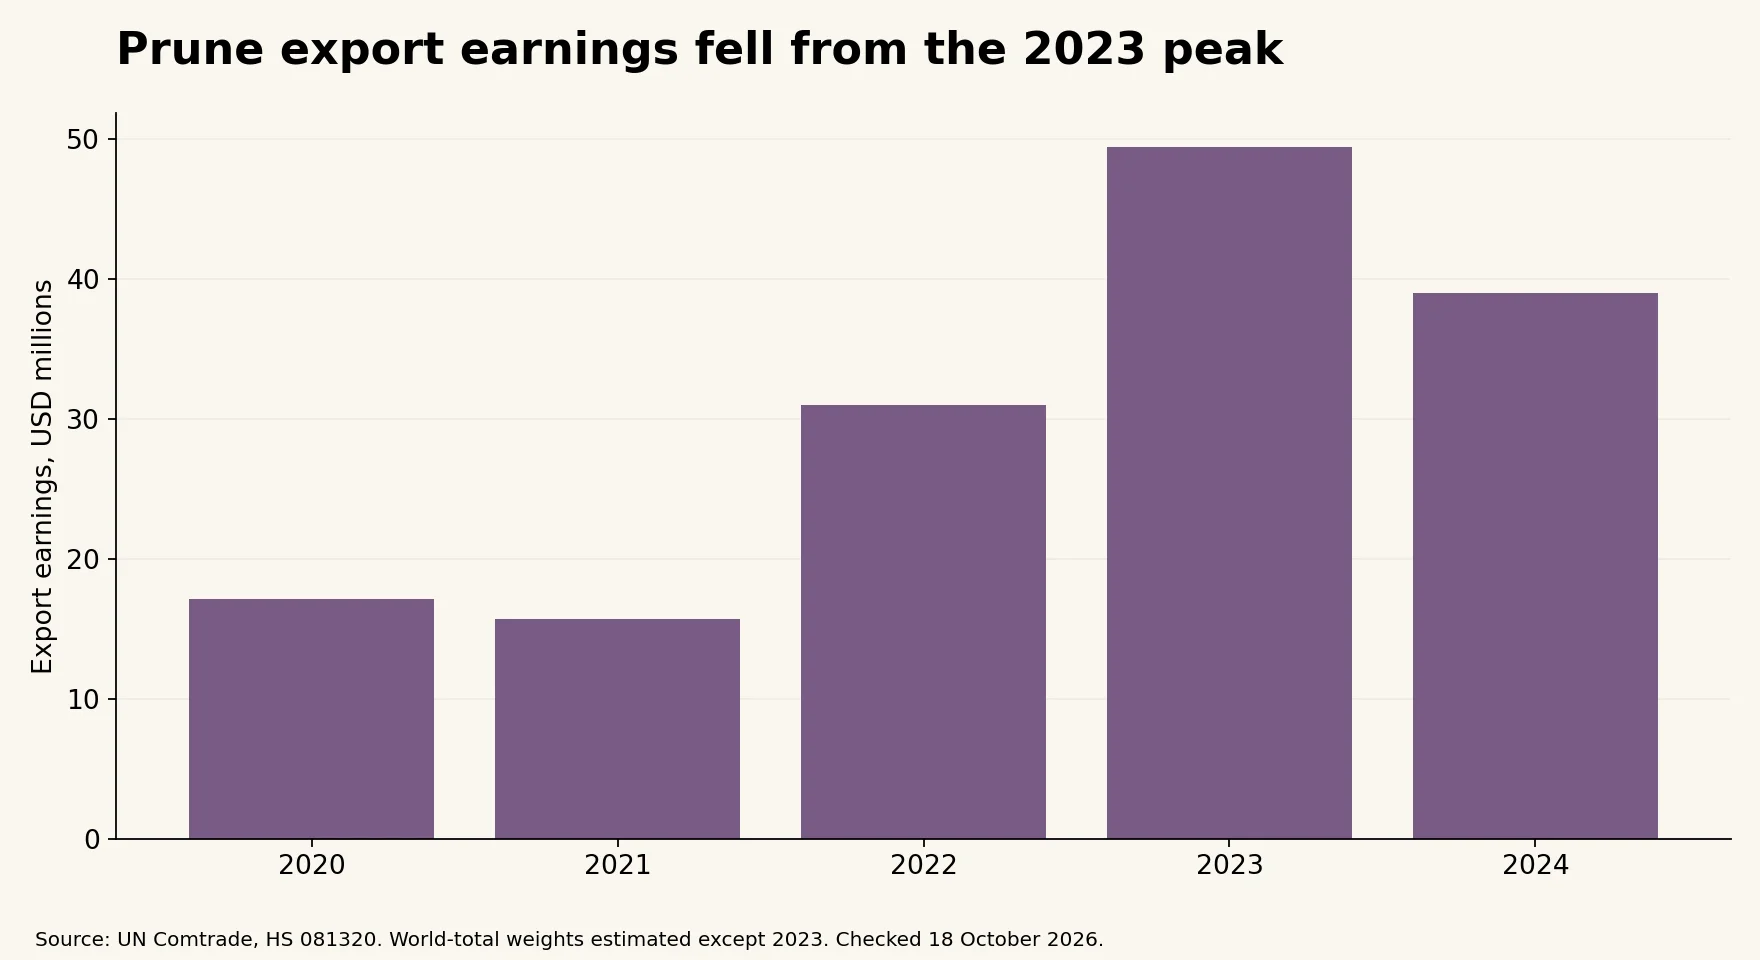
Uzbekistan’s dried plum exports earned $39.0 million in 2024, down 21.1% from $49.4 million in 2023. Recorded net weight fell faster, from approximately 38,481 tonnes to 27,662 tonnes, a decline of 28.1%. The smaller recorded quantity was accompanied by a higher aggregate value per kilogram, which cushioned the fall in earnings.
This report covers dried prunes under HS 081320. It excludes fresh plums and sloes, which are classified under HS 080940. Separating these categories matters: drying changes weight and processing requirements, so the two products cannot be treated as interchangeable quantities.
The five-year series shows a substantial expansion followed by a partial reversal. Export earnings were $17.2 million in 2020 and $15.7 million in 2021, then rose to $31.0 million in 2022 and $49.4 million in 2023. Although 2024 was weaker than the preceding year, earnings remained above their 2022 level and more than twice their 2020 level in current dollars.
!Annual dried prune export earnings
China took half of export value
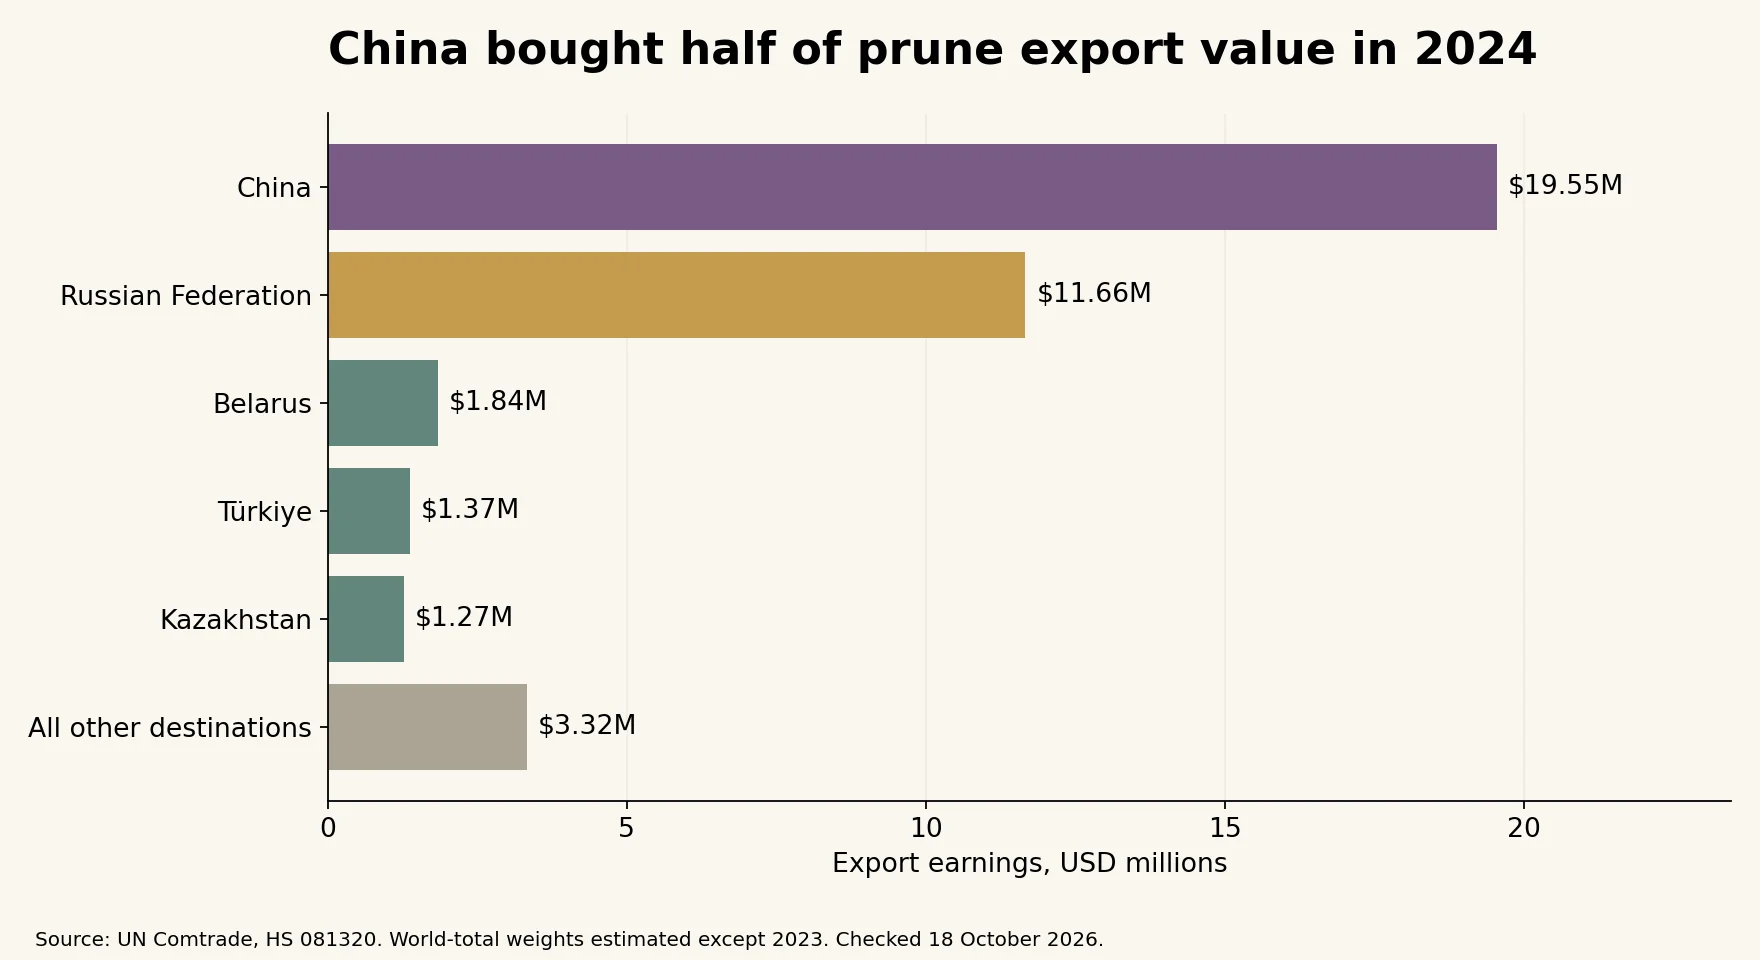
China bought $19.5 million of Uzbekistan’s prunes in 2024, or 50.1% of total export value. Russia followed with $11.7 million, or 29.9%. Together, the two buyers accounted for 80.0% of earnings. China alone purchased more by value than every other destination combined.
Other markets were much smaller. Belarus bought $1.8 million, Türkiye $1.4 million and Kazakhstan $1.3 million. Belgium purchased approximately $0.9 million. The complete 2024 records contain 32 positive-value partner entries, but most earnings were concentrated in the two leading markets.
China and Russia were also the two largest buyers in 2023, when their combined share was 67.6%. Their share increased to 80.0% in 2024 while total receipts declined. This is a reminder that concentration can increase without a large expansion in purchases by the leading market.
!Dried prune destination values
China’s purchases rose only slightly, from $19.2 million in 2023 to $19.5 million in 2024, an increase of about 1.6%. Its share rose much more strongly because the overall export market contracted. Russia’s purchases actually declined from $14.2 million to $11.7 million, yet its share edged up because its decline was smaller than the decline in total receipts.
The contraction extended beyond Russia
The roughly $2.5 million reduction in Russia’s purchases explains only part of the $10.4 million decline in total export earnings. China partly offset that reduction, while sales to the remaining destinations contracted more substantially in aggregate.
Lithuania illustrates that wider retreat: recorded purchases fell from approximately $2.8 million in 2023 to $0.2 million in 2024. Several other destinations also bought less. The records describe where the contraction occurred, but do not explain whether it reflected changes in demand, shipment timing, contracts, product availability or trade routing.
The 2023 partner list includes $1.0 million assigned to an unspecified destination. It remains in the world total and is not allocated to a named country in this analysis. This limitation does not alter the reported purchases of China and Russia, but it matters when interpreting changes in the wider destination map.
Destination records identify immediate trading partners rather than final consumers. A shipment to a trading hub may subsequently be re-exported. The dataset cannot establish how many importing firms were involved or where every prune was ultimately consumed.
What the value per kilogram can tell us
Dividing export earnings by net weight gives an aggregate export unit value of approximately $1.41 per kilogram in 2024, compared with $1.28 in 2023. The increase was 9.8%. This higher ratio was insufficient to offset the fall in recorded weight, leaving total earnings lower.
Unit values varied substantially across destinations. China’s 2024 records imply about $1.14 per kilogram, while Russia’s imply about $2.34. The difference does not establish that Russia was more profitable for exporters. Product grades, processing, packaging, shipment timing and contract terms can differ, while the data do not deduct production or delivery costs.
!Dried prune aggregate export unit values
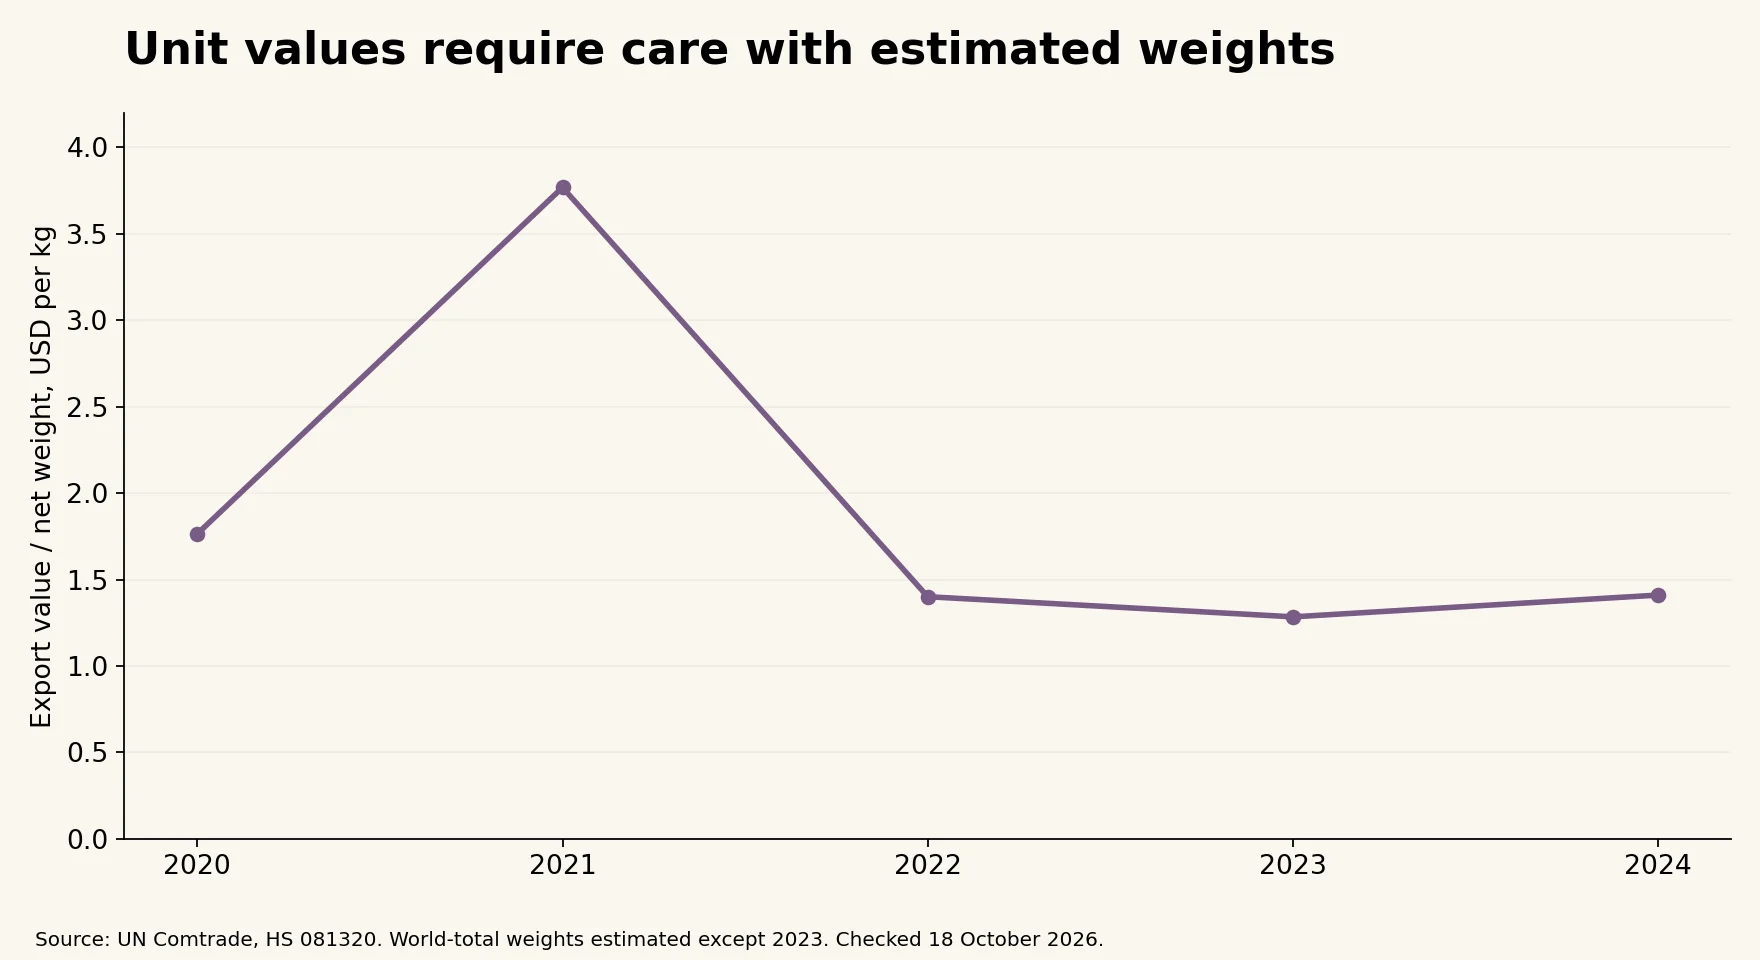
The historical series also requires caution. UN Comtrade flags the world-total net weights in 2020–2022 and 2024 as estimated; 2023 is not flagged. The calculated unit value of approximately $3.77 in 2021 should therefore not be read as a directly observed market-price spike. Estimation and changes in export composition can affect the ratio.
Unit value is an aggregate accounting measure. It is not a retail price, an individual exporter’s selling price, or a measure of farmer income. The relationship between earnings, recorded weight and unit value is useful, but the reasons behind changes require more detailed commercial evidence.
Questions for the next season
The 2024 result combines lower earnings, lower recorded weight and greater concentration in China and Russia. China’s position strengthened mainly because other sales weakened, rather than because its purchases expanded sharply.
The next useful questions are whether shipments recover and whether destinations outside the two leading buyers regain a meaningful share. A broader recovery would provide a different picture from growth driven predominantly by one large market. Explaining either outcome would require shipment-level information and evidence on product specifications, costs and contracts.
Sources and method
The annual dataset contains five UN Comtrade world-total records for 2020–2024. The destination dataset contains 184 partner-year records for the same period and excludes world totals to prevent double-counting. Partner values reconcile to the annual world value within $0.10 in every year. The 2024 partner values sum exactly to the world total.
The source query uses annual goods, Uzbekistan reporter 860, exports, HS 081320, partner2 0, customs C00 and transport mode 0. Each year was queried separately through the UN Comtrade preview API. Original classifications are H5 for 2020–2022 and H6 for 2023–2024. Partner names are mapped from the UN Comtrade partner reference list. World Bank WITS tables provide a rounded cross-check.
Values are current US dollars. Tonnes equal net kilograms divided by 1,000; unit value equals export USD divided by net kilograms. Shares use the same year’s world total. Percentage changes compare 2024 with 2023 using unrounded source records. Estimated weights remain identified in the downloadable files. The report describes recorded trade and does not estimate causal effects, profits or regional production.
Data and sources were checked on October 18, 2026. September 10 is the series date.
Download the datasets
Export destinations, 2020–2024 · Annual exports, 2020–2024
Cover photograph
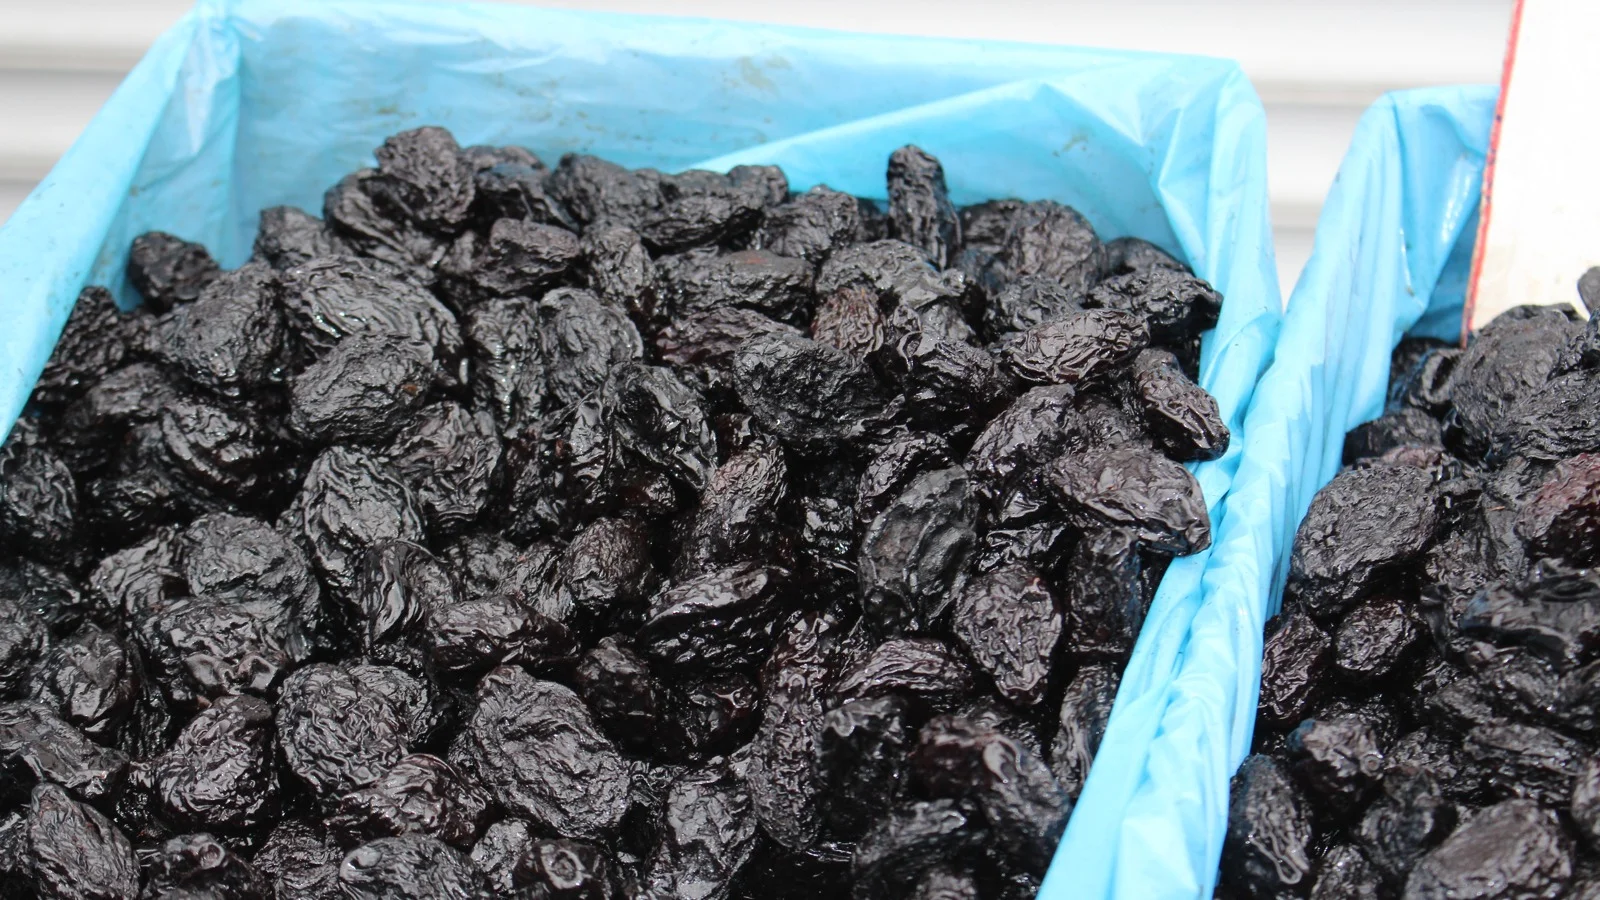
Emőke Dénes, Dried Prunus domestica, CC BY-SA 4.0. Cropped and resized; the cover image remains under CC BY-SA 4.0. Cropped for the cover format. Illustrative photograph; it does not document a shipment or farm in Uzbekistan.
