
A retreat from the 2023 peak
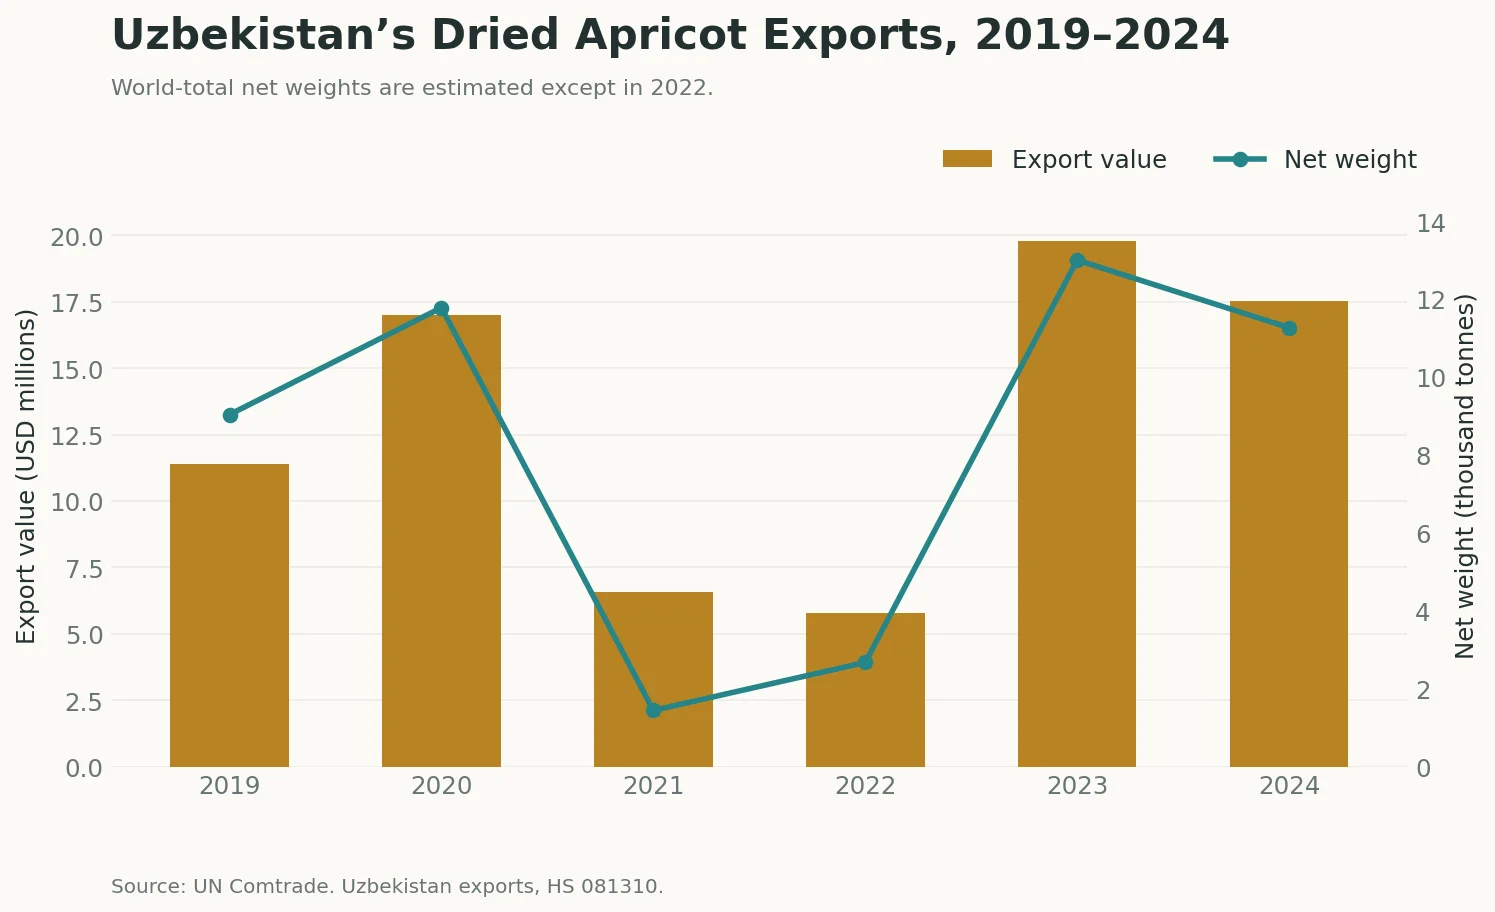
Uzbekistan exported $17.5 million of dried apricots in 2024, down from $19.8 million in 2023. Recorded net weight fell more sharply, from 12,999 tonnes to 11,264 tonnes, a decrease of 13.3%. The decline in earnings therefore accompanied a smaller recorded quantity rather than a fall in the average value per kilogram.
The longer series shows considerable variation. Export receipts rose from $11.4 million in 2019 to $17.0 million in 2020, then fell to $6.6 million in 2021 and $5.8 million in 2022. The rebound in 2023 brought the highest earnings in the six-year period. Despite the subsequent decline, the 2024 value remained 53.6% above 2019 in current dollars.
This report covers dried apricots under HS 081310. Fresh apricots, classified under HS 080910, are excluded. The distinction allows the dried product’s trade pattern to be studied separately, without adding together quantities with different moisture content and commercial characteristics.
Source: UN Comtrade, processed by Central Asia Trade Research.
China leads a broad destination list
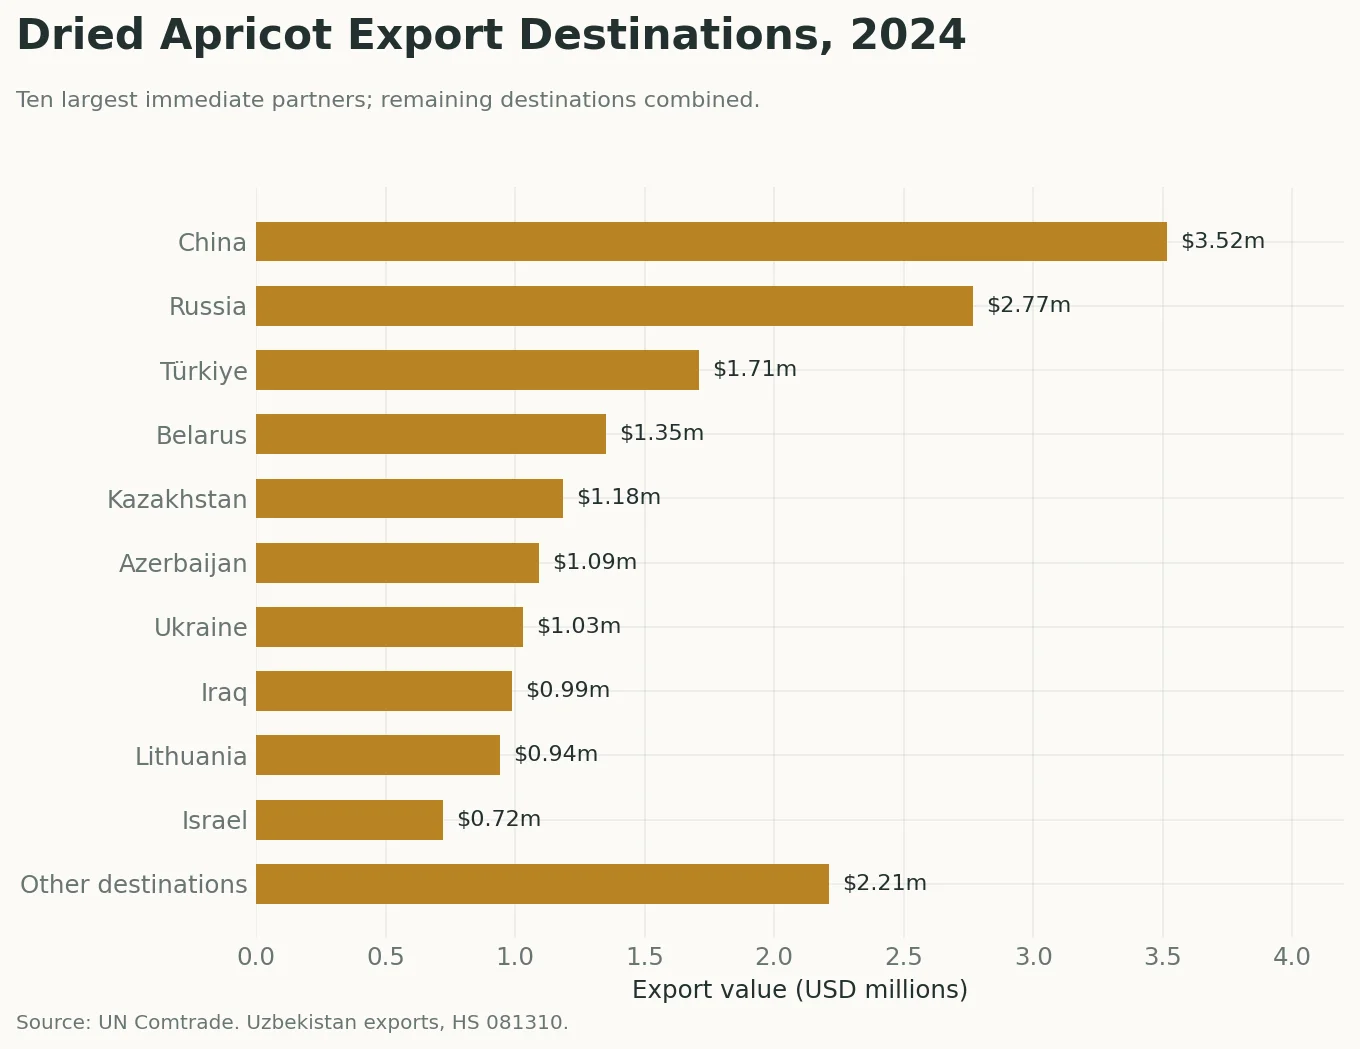
China bought $3.5 million of Uzbekistan’s dried apricots in 2024, accounting for 20.1% of export value. Russia followed with $2.8 million, or 15.8%, and Türkiye with $1.7 million, or 9.8%. Together, these three buyers accounted for 45.6% of earnings.
There were other substantial markets. Belarus purchased $1.4 million, Kazakhstan $1.2 million, Azerbaijan $1.1 million and Ukraine $1.0 million. Iraq and Lithuania were each close to $1 million. This distribution matters because a market can have many recorded destinations while most earnings still come from a very small number of them.
The 2024 records contain 39 destinations with positive export values, the same count as in 2023. Yet the share going to the three largest buyers declined from 56.9% to 45.6%. On this measure, sales became less concentrated even though the number of destinations did not change. The identities of the three leading buyers were the same in both years, but their order and relative importance changed.
Türkiye had been the largest buyer in 2023, just ahead of China. Its purchases fell from $4.3 million to $1.7 million in 2024. China’s purchases also declined, from $4.3 million to $3.5 million. China became the leading destination because Türkiye’s recorded purchases fell more sharply, rather than because sales to China increased.
!Dried apricot export destinations
A smaller market share can accompany weaker sales
The decline in Türkiye’s purchases was about $2.6 million, larger than the $2.2 million decline in total export earnings. Taken together, the other destinations therefore partly offset that loss. Russia’s purchases, for example, increased slightly from $2.73 million to $2.77 million.
These figures show why diversification and export growth should be tracked separately. A wider spread of sales can reduce exposure to an individual buyer, but it does not guarantee that total earnings will rise. Here, the smaller top-three share accompanied an overall contraction.
The destination records identify immediate trading partners. They do not establish where the fruit was ultimately consumed, whether it was re-exported, or how many individual firms bought it. The data support a description of the distribution of recorded export sales, rather than a claim that particular marketing efforts caused diversification.
What the value per kilogram tells us
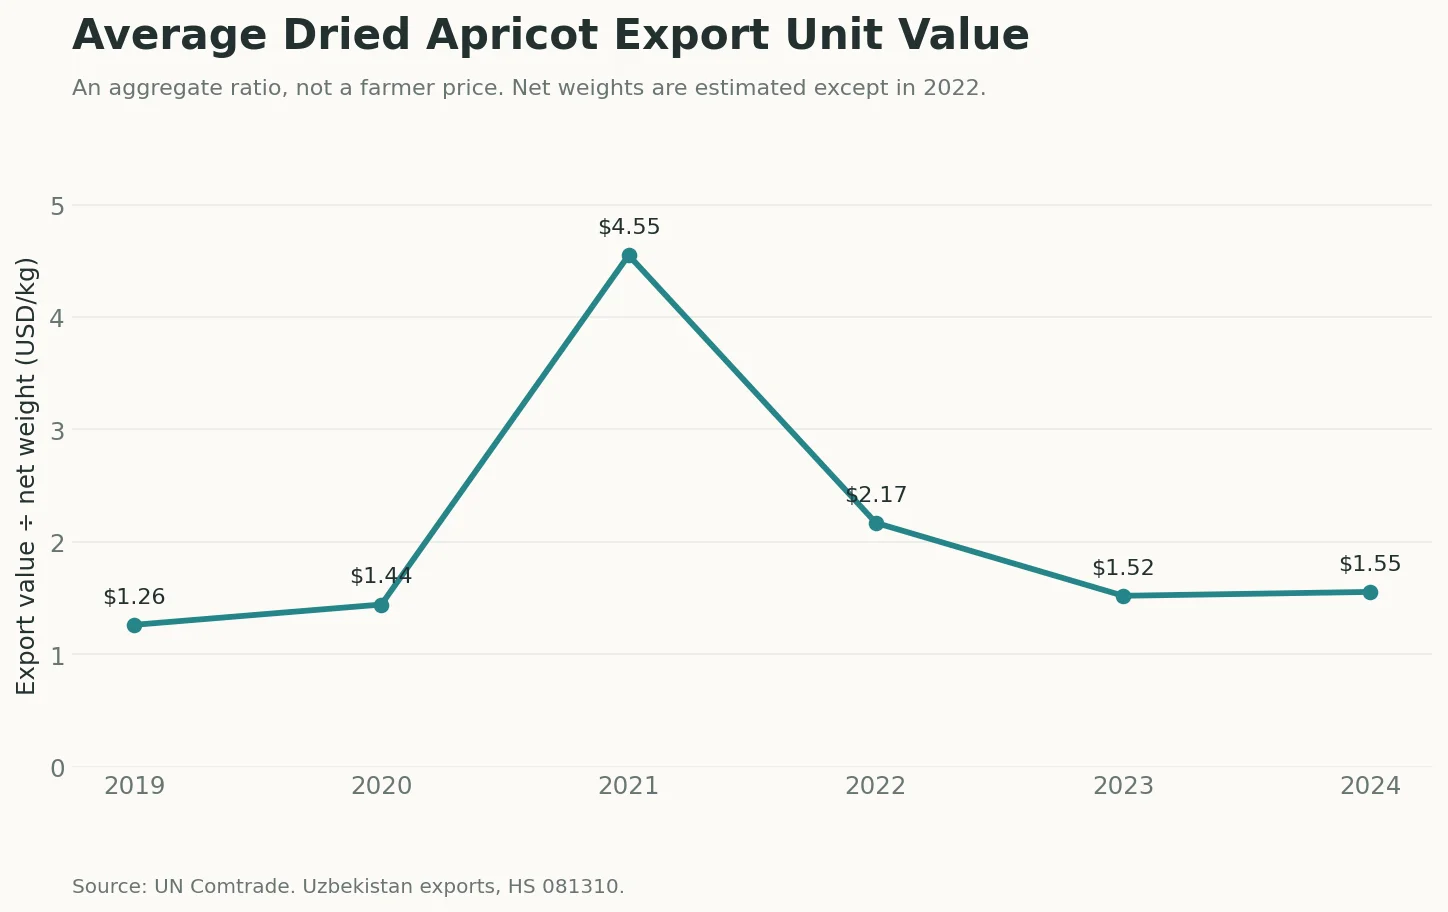
Dividing export value by net weight gives an average export unit value of $1.55 per kilogram in 2024, compared with $1.52 in 2023. This was an increase of 2.3%, much smaller than the fall in recorded export weight. The slightly higher unit value was insufficient to prevent total receipts from declining.
Destination averages differed. China’s recorded purchases imply about $1.06 per kilogram, Russia’s about $2.00 and Türkiye’s about $1.61. Such differences are useful starting points for further investigation, but they do not establish that one market was more profitable. Grades, varieties, processing, packaging, shipment timing and contract terms can differ, while this dataset does not measure production or delivery costs.
The historical unit-value series also requires care. UN Comtrade flags world-total net weights as estimated in 2019–2021 and 2023–2024; the 2022 total is not flagged. The unusually high calculated unit value of $4.55 per kilogram in 2021 should therefore not be read as a directly observed market-price jump. Changes in reporting and the composition of exports can affect the ratio.
Source: UN Comtrade, processed by Central Asia Trade Research.
Two questions for the next season
The 2024 result combines lower export earnings with a wider distribution of sales among the leading destinations. China’s position as the largest immediate buyer is distinctive, but no individual destination accounted for more than one quarter of receipts.
The next useful questions are whether Uzbekistan can recover export volume while maintaining a broad set of meaningful buyers, and whether destination-specific unit values remain stable across seasons. Answering why these outcomes change would require information beyond annual trade totals, including shipment timing, product specifications and commercial costs.
Sources and method
The underlying records come from UN Comtrade: goods, annual frequency, Uzbekistan reporter code 860, exports, HS 081310, all immediate partner destinations, partner2 code 0, customs C00 and transport code 0. Original classifications are H5 for 2019–2022 and H6 for 2023–2024. The World Bank WITS 2024 table provides an additional check on the rounded headline and destination values.
The annual dataset contains six world-total records. The destination dataset contains 213 partner-year records and excludes world totals to prevent double-counting. Destination values reconcile to annual totals within $0.05 in every year; net weights reconcile within 0.05 kilograms. Values are current US dollars. Tonnes equal net kilograms divided by 1,000. Unit value equals export value divided by net kilograms. Shares and percentage changes use unrounded records.
The top-three share is the combined value of each year’s three largest destinations divided by its world total. All positive-value destinations are included when counting markets. No 2025 records were returned by the preview API, so 2025 is omitted rather than recorded as zero. Trade receipts do not measure farmer income or exporter profit. The cover is an AI-generated illustration.