Four products, four different results
Uzbekistan’s fruit exports do not tell a single story. In 2024, raisins generated the most export earnings among the four products examined here, fresh apricots recorded the fastest earnings growth, and sweet cherries had the highest average export value per kilogram. Russia’s importance differed even more sharply: it bought about four fifths of sweet-cherry exports by value, compared with less than one tenth of raisin exports.
This comparison brings together the first four product reports in this series: raisins (HS 080620), sweet cherries (HS 080929), fresh apricots (HS 080910) and dried apricots (HS 081310). It uses 2024 as a common full year and compares changes from 2023. Fresh grapes are outside this four-product comparison.
Raisins led earnings; fresh apricots led weight
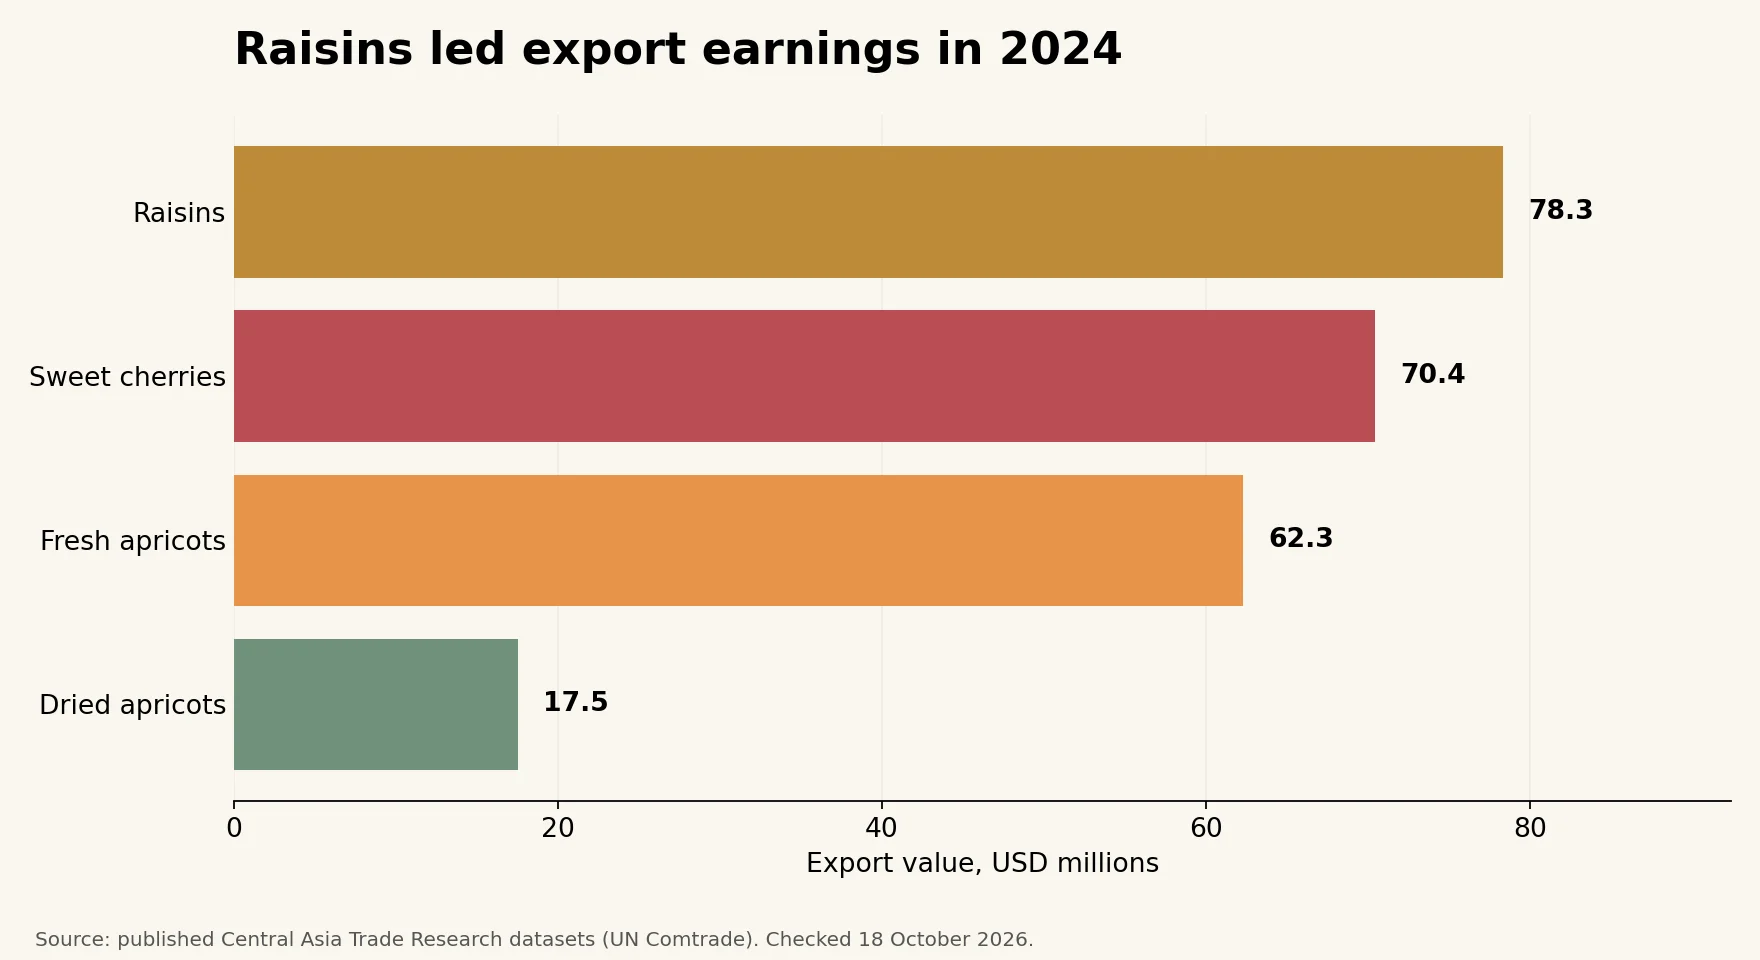
Raisin exports earned $78.3 million in 2024. Sweet cherries followed at $70.4 million, fresh apricots at $62.3 million and dried apricots at $17.5 million. Together, these four categories generated approximately $228.5 million. This is their combined total, not the value of all Uzbek fruit exports.
The ranking by shipped weight was different. Fresh apricots led with approximately 64,785 tonnes, followed by raisins at 52,963 tonnes, sweet cherries at 32,215 tonnes and dried apricots at 11,264 tonnes. A larger physical shipment total therefore did not automatically produce higher earnings.
Sweet cherries recorded the highest aggregate unit value, about $2.19 per kilogram. Dried apricots followed at $1.55, raisins at $1.48 and fresh apricots at $0.96. These ratios divide export earnings by net weight. They are not retail prices, farmer incomes or exporter profits.
Fresh and dried products also differ in moisture content and processing. A kilogram of dried fruit is not equivalent to a kilogram of fresh fruit. These figures cannot establish whether drying apricots was more profitable than selling them fresh: that would require drying yields, processing expenses, product grades and delivery costs.
Russia mattered much more to fresh fruit
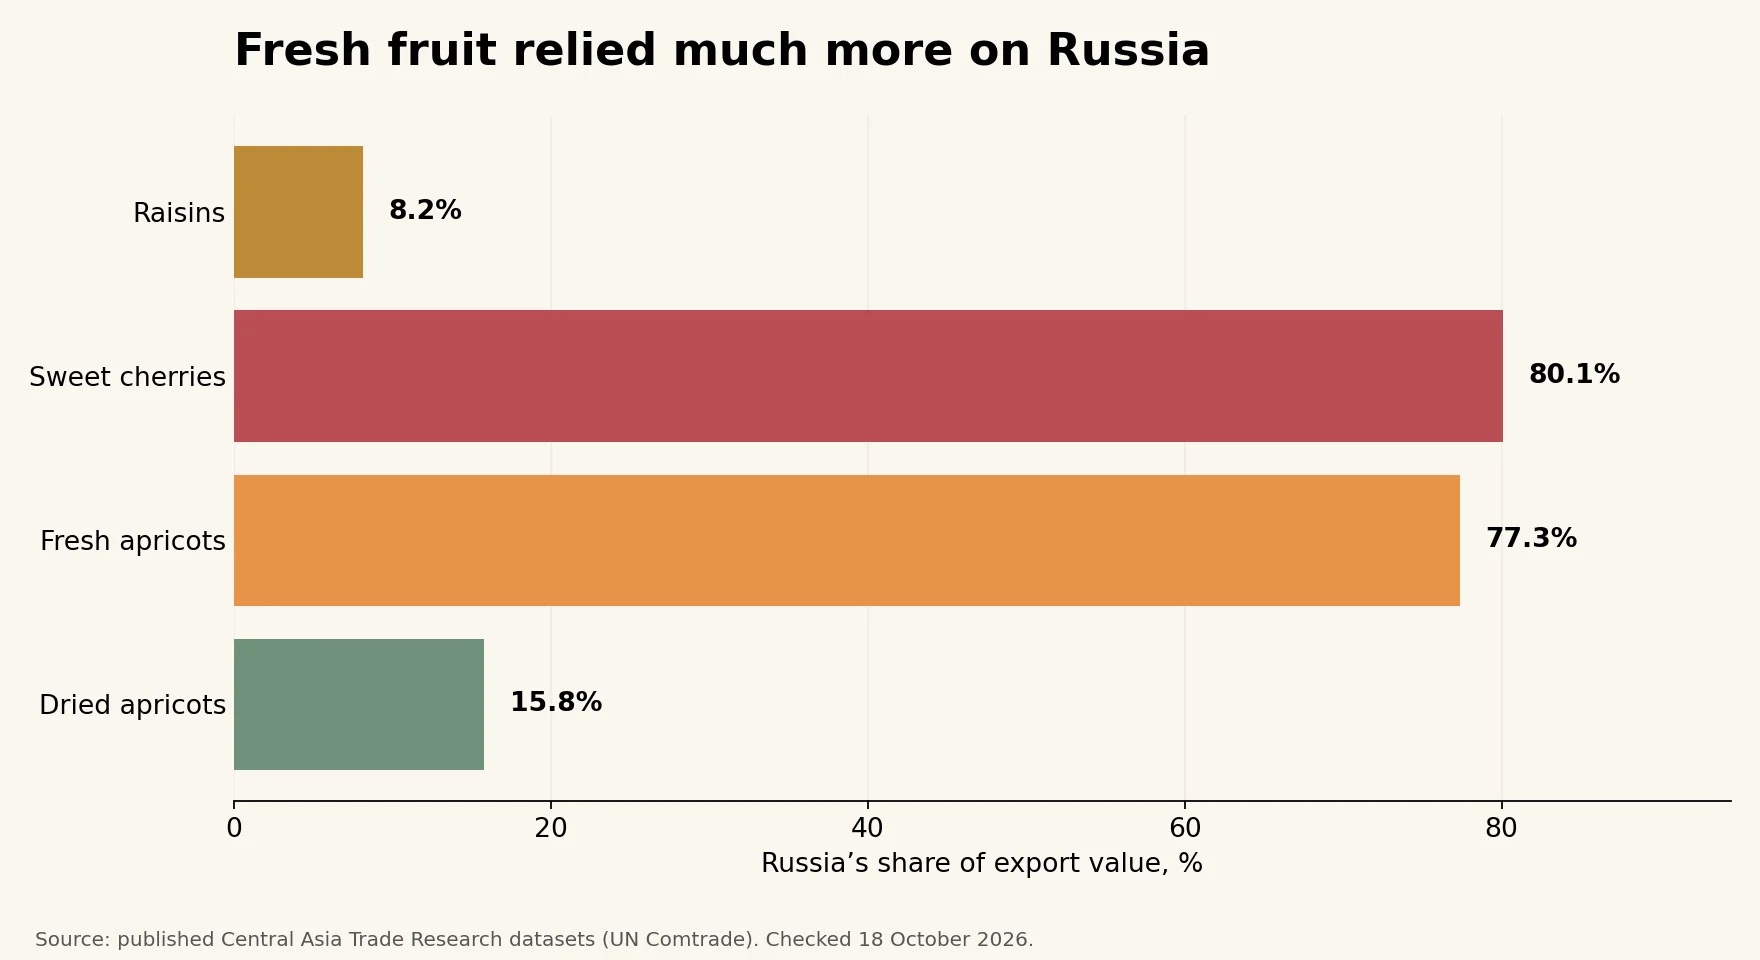
Russia purchased approximately $56.4 million of sweet cherries, representing 80.1% of that product’s export earnings. Its fresh-apricot purchases were $48.2 million, or 77.3%. Both fresh-fruit categories therefore depended heavily on one immediate export destination in 2024.
For dried apricots, Russia’s share was 15.8%, while China was the largest buyer at 20.1%. For raisins, Russia accounted for 8.2%; Türkiye was the largest buyer by value at 18.2%. The World Bank WITS destination table confirms Türkiye’s leading position for raisins, a distinction that is easy to miss when destinations are ranked by quantity instead of earnings.
!Russia share of export earnings
Lower reliance on Russia does not, by itself, prove that a product has a fully diversified market base or faces lower overall commercial risk. Other buyers, prices and logistics still matter. The raisin destination dataset on this website contains selected markets rather than a complete partner list, so this report does not calculate a comparable destination count or top-three concentration ranking across all four products.
The destination figures identify immediate trading partners. They do not reveal where every shipment was ultimately consumed or whether it was subsequently re-exported. Nor does this comparison establish why the fresh and dried categories developed different market patterns.
Earnings rose while shipped weight fell
Fresh-apricot earnings rose 37.7% from 2023 to 2024, the fastest increase among these four products. Sweet-cherry earnings increased 22.7%, and raisin earnings rose 1.0%. Dried-apricot receipts declined 11.4%.
Yet recorded export weight fell in every category: by 5.8% for fresh apricots, 35.6% for sweet cherries, 19.8% for raisins and 13.3% for dried apricots. The three products with growing receipts therefore earned more while shipping less recorded weight.
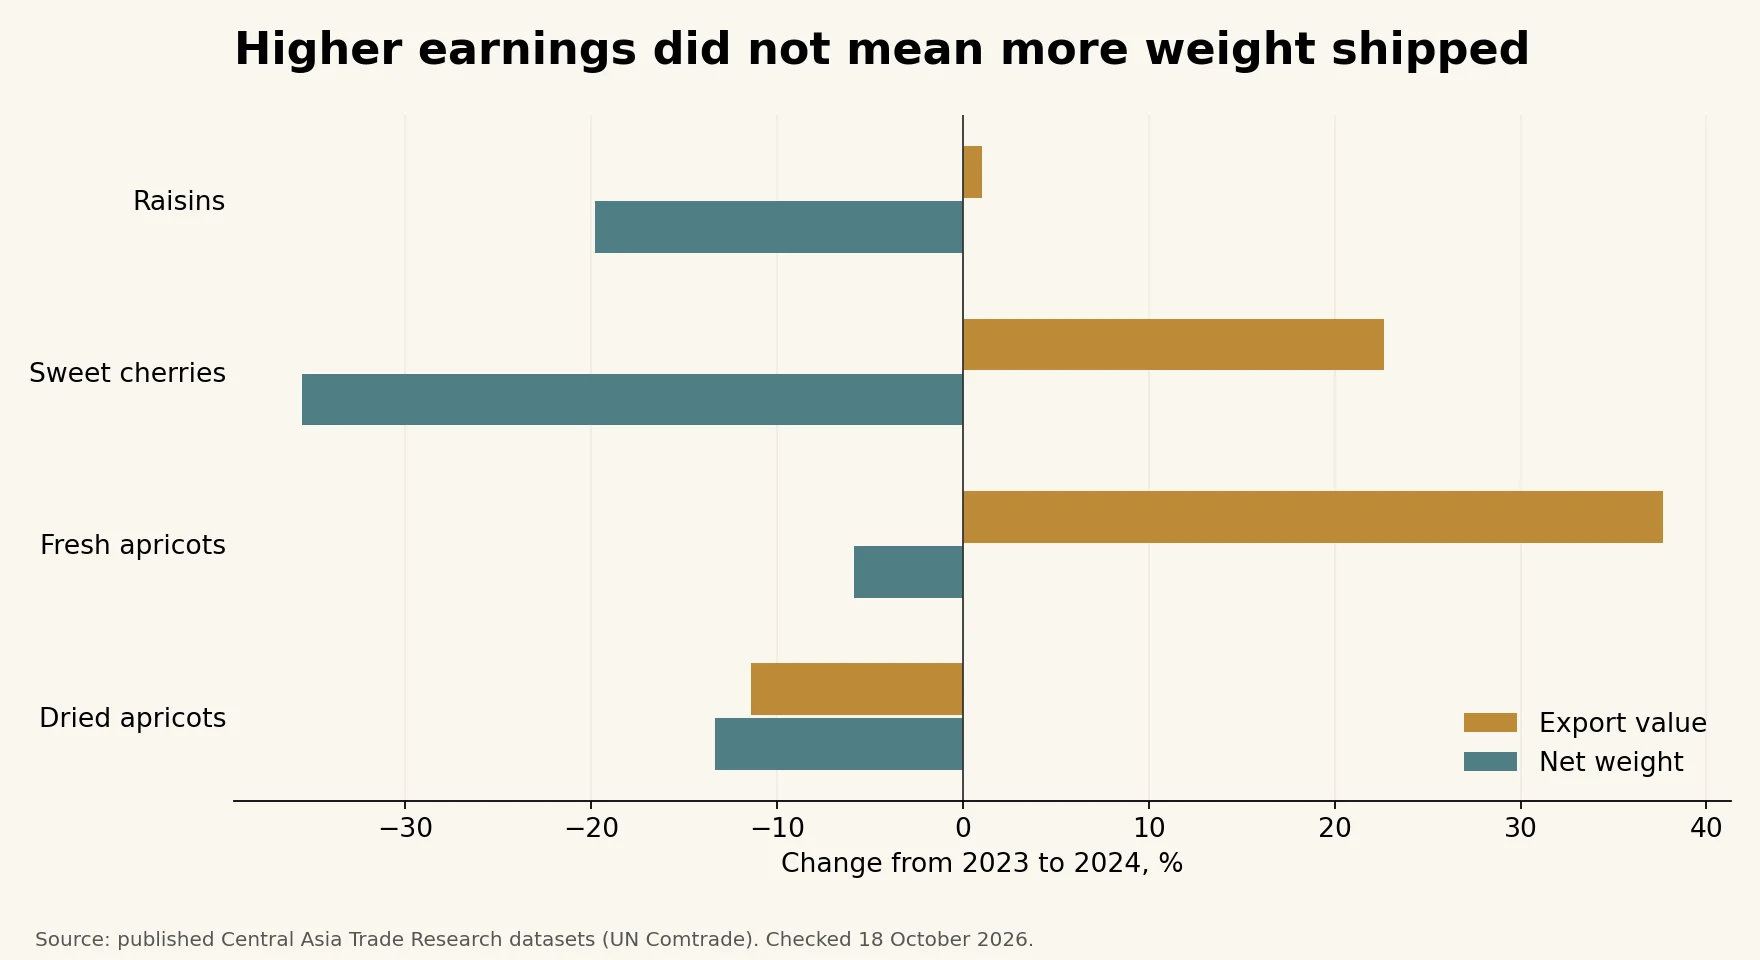
The accounting relationship is straightforward: export earnings equal shipped weight multiplied by aggregate unit value. Higher unit values offset lower recorded weights for raisins, sweet cherries and fresh apricots. For dried apricots, a small unit-value increase was insufficient to offset the decline in weight.
This does not prove that every exporter raised prices, that product quality improved, or that profits increased. Changes in grades, destinations, shipment timing and reporting can also affect the ratios. In particular, UN Comtrade flags 2023 world-total weights for sweet cherries and fresh apricots as estimated, and both the 2023 and 2024 dried-apricot world-total weights as estimated. Weight changes and derived unit values should be read with that limitation.
What should be tracked next?
There is no single winner across every measure. Raisins led export earnings and had the smallest direct Russia share. Fresh apricots had the largest shipped weight and the fastest earnings growth. Sweet cherries had the highest unit value alongside the greatest reliance on Russia. Dried apricots had lower earnings and China as their leading buyer.
The next useful test is whether these patterns persist: can the fresh-fruit categories maintain earnings while rebuilding shipped volume, and can the dried-fruit categories expand receipts without becoming excessively dependent on individual destinations? A single year provides a comparison, not evidence of a permanent advantage.
Sources and method
This article uses the eight published annual and destination datasets linked below. Their underlying source is UN Comtrade, with Uzbekistan as reporter, exports as flow and the product codes stated above. Annual totals include the world partner; destination records exclude world totals. Values are current US dollars; tonnes equal kilograms divided by 1,000.
Growth is calculated as (2024 value / 2023 value − 1) × 100. Russia’s share is its 2024 export value divided by the same product’s 2024 world total. Unit value is world-total earnings divided by world-total net weight. Calculations use the figures displayed in the published tables, which round monetary values to dollars; results are presented at a precision appropriate to that rounding. Differences in the source datasets’ historical coverage do not affect the common 2023–2024 comparison.
Data and source links were checked on October 18, 2026. August 30 is the series date. This analysis describes recorded trade patterns and does not estimate causal effects, farm profitability or consumer demand.
Additional check: World Bank WITS, raisins in 2024.
Cover photograph
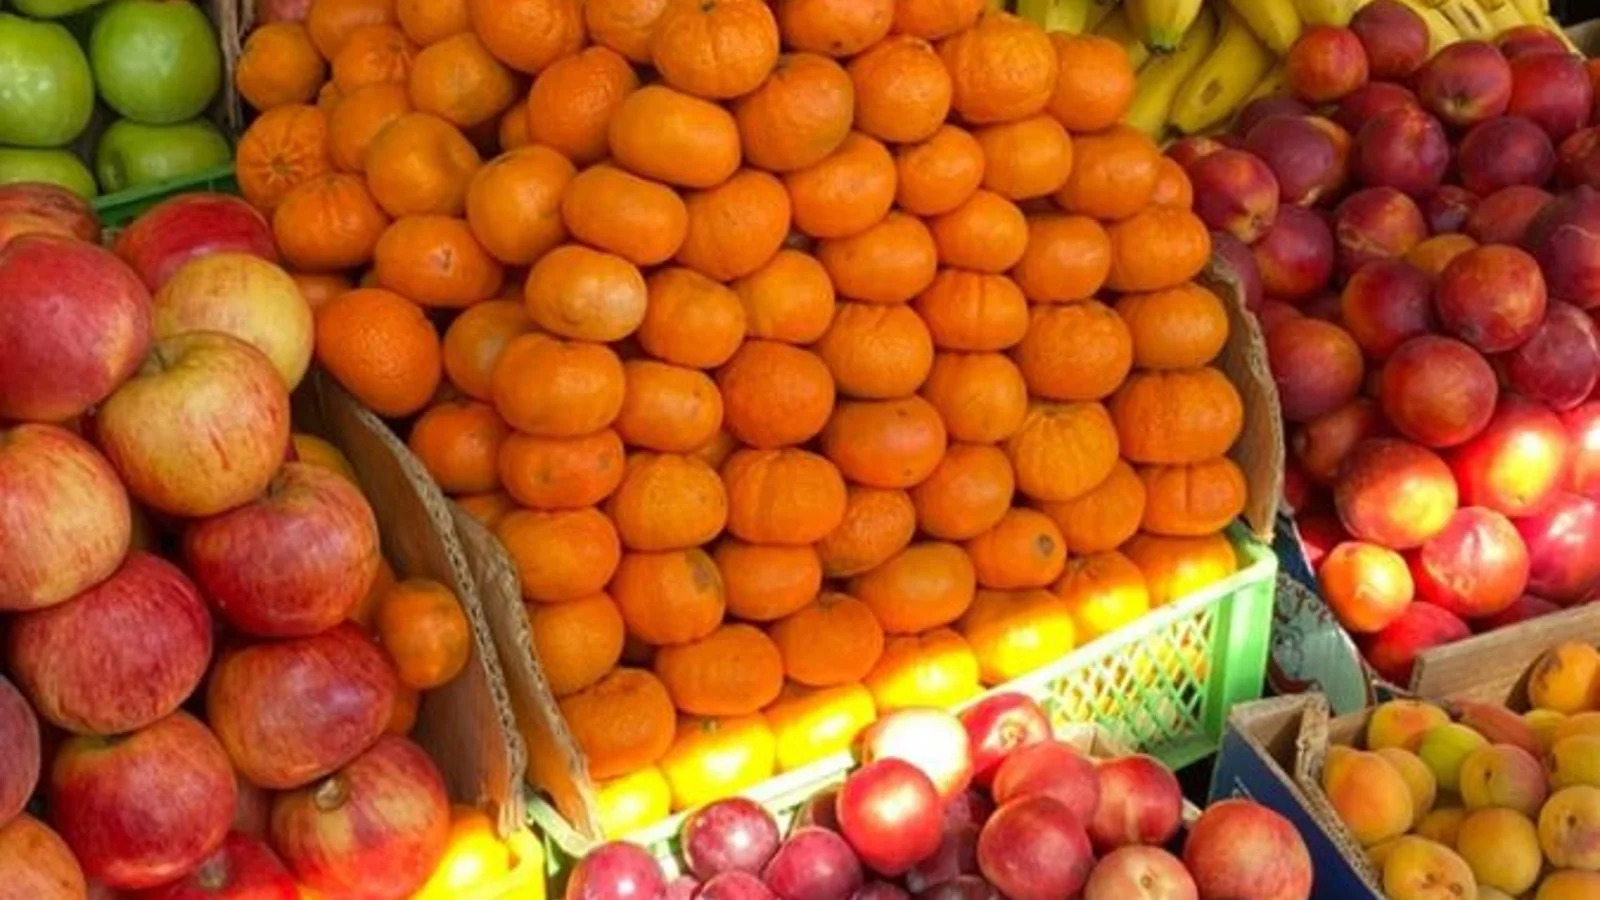
Mythili Perumal, Fruit market all types, CC0. Cropped for the cover format. Illustrative photograph; it does not document a shipment or farm in Uzbekistan.
